Preview
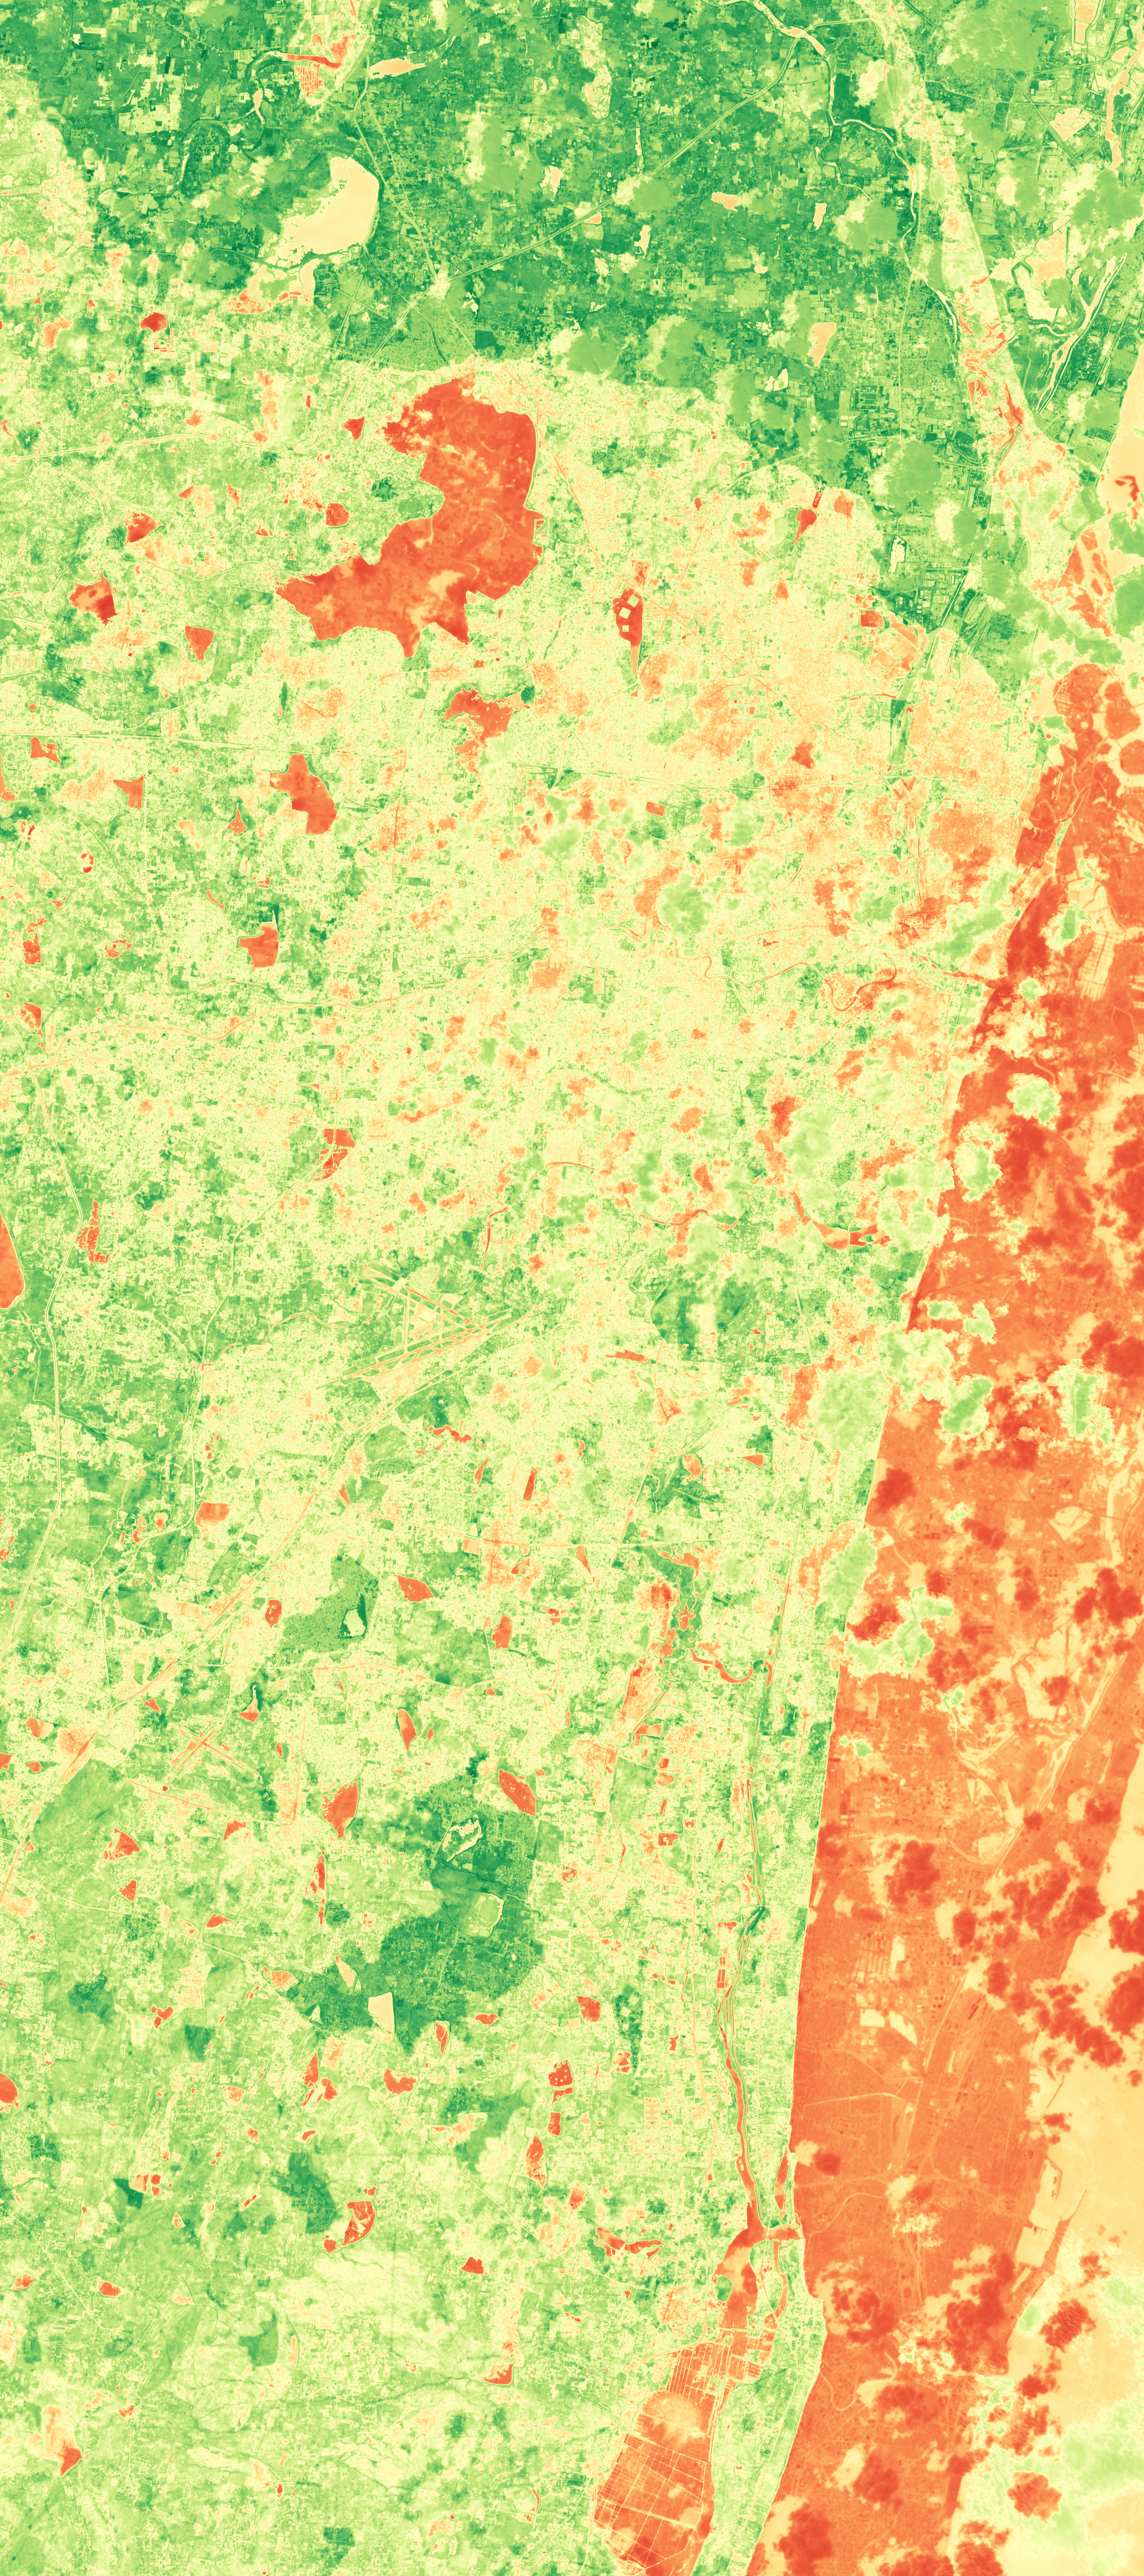
In the bustling city of Chennai, the year 2025 brings a renewed focus on environmental monitoring and urban planning. Utilizing advanced satellite imagery and data analytics, we delve into the city's ecological health through various indices. The Normalized Difference Vegetation Index (NDVI) reveals a vibrant green cover, indicating healthy vegetation across urban parks and green belts. Complementing this, the Normalized Difference Built-up Index (NDBI) highlights the extensive built-up areas, showcasing the city's growth and development.
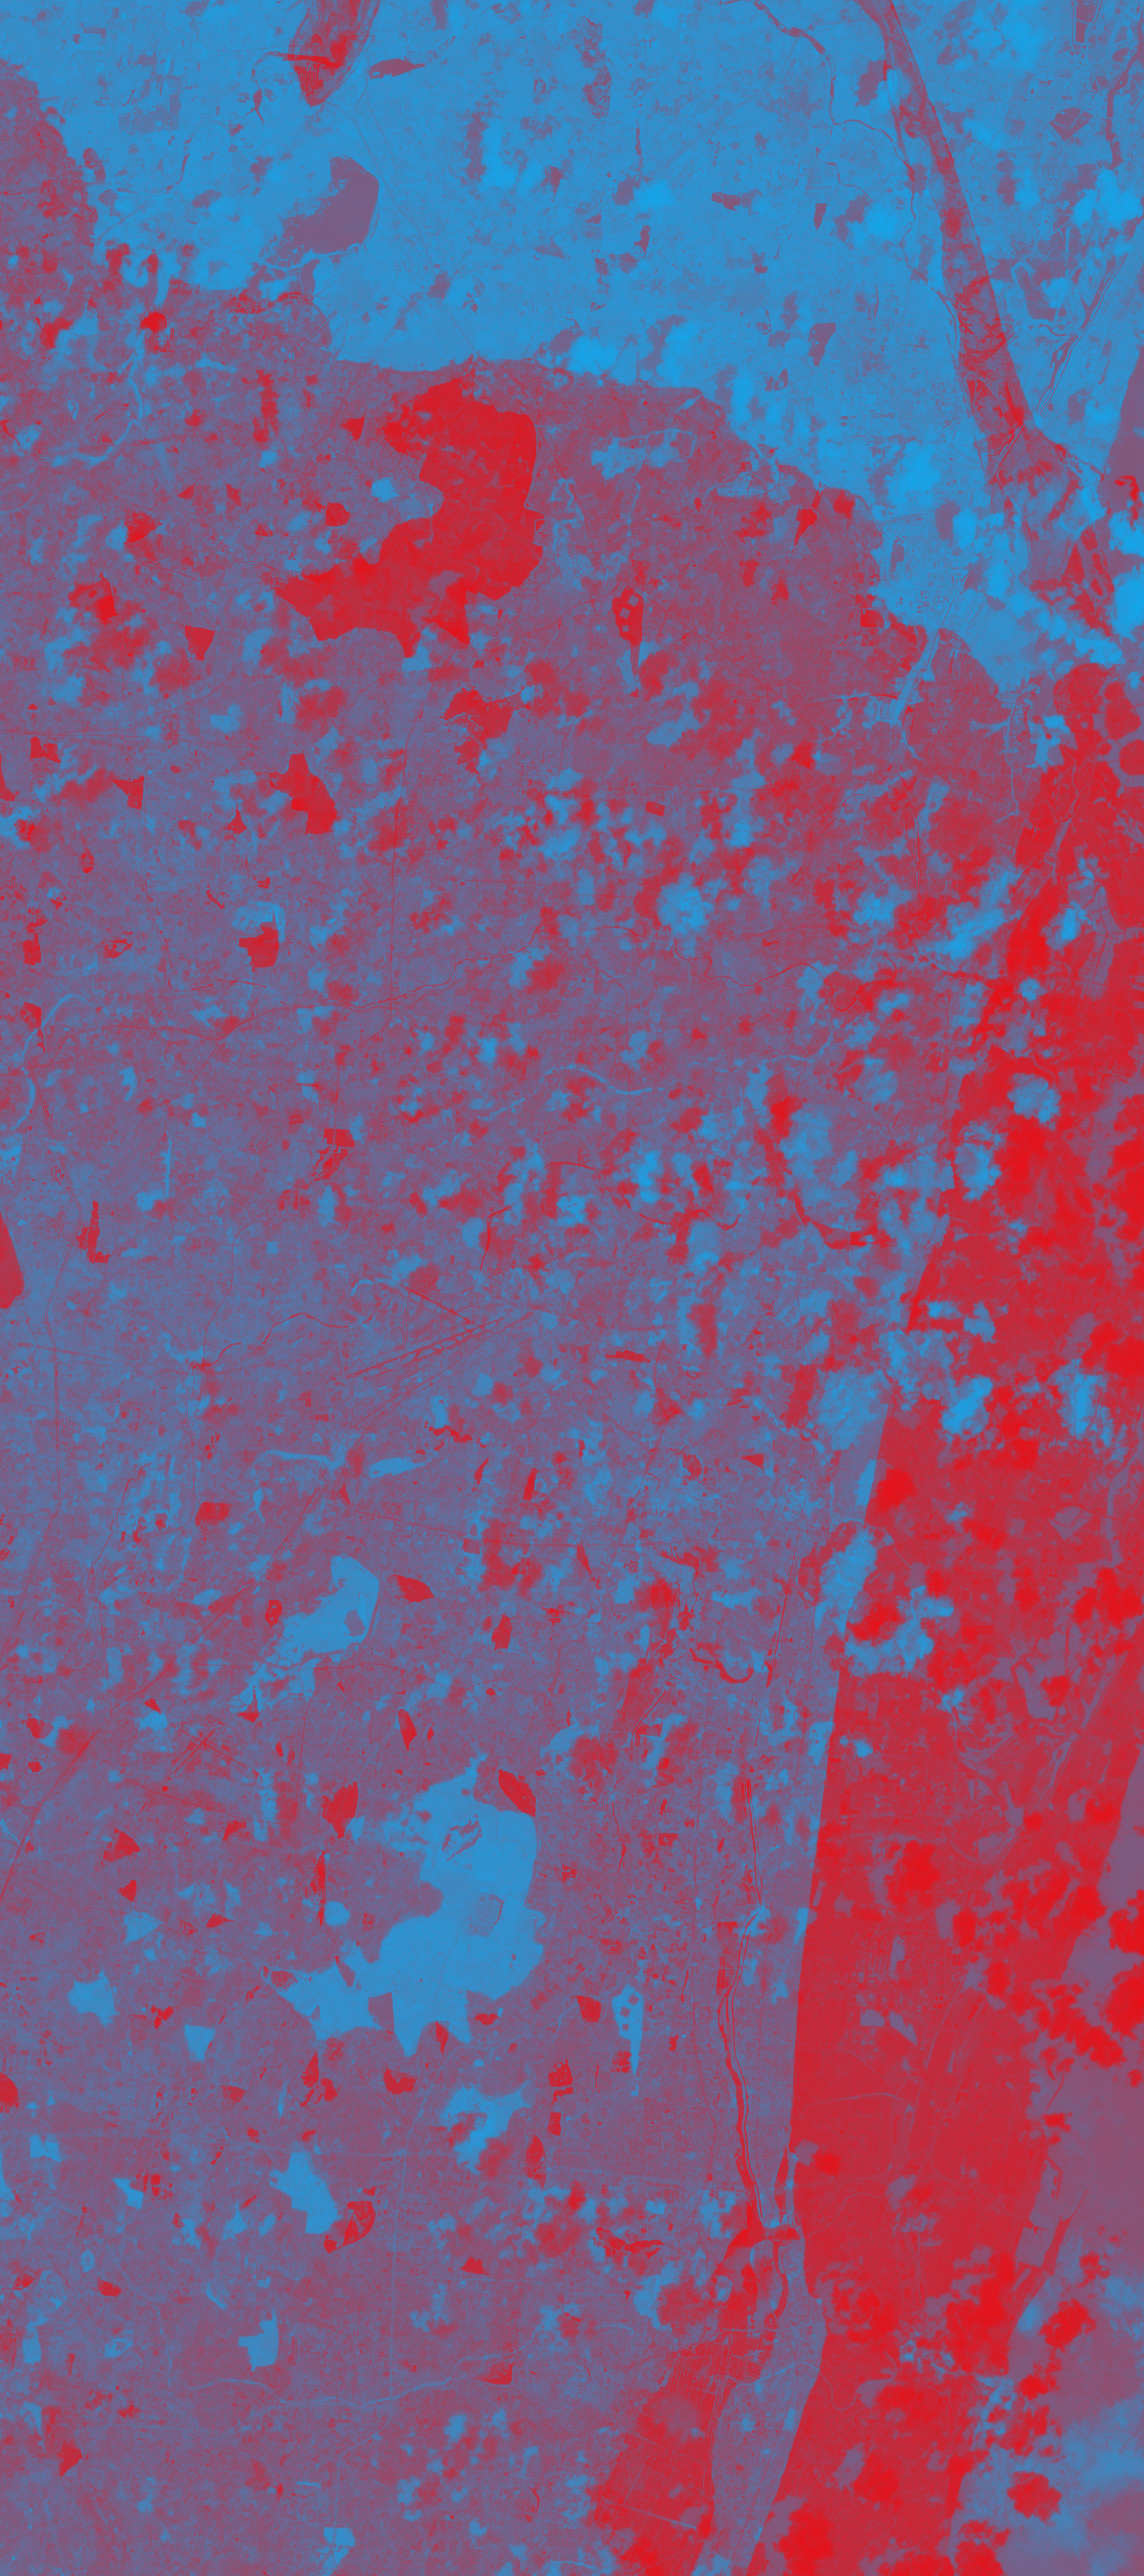
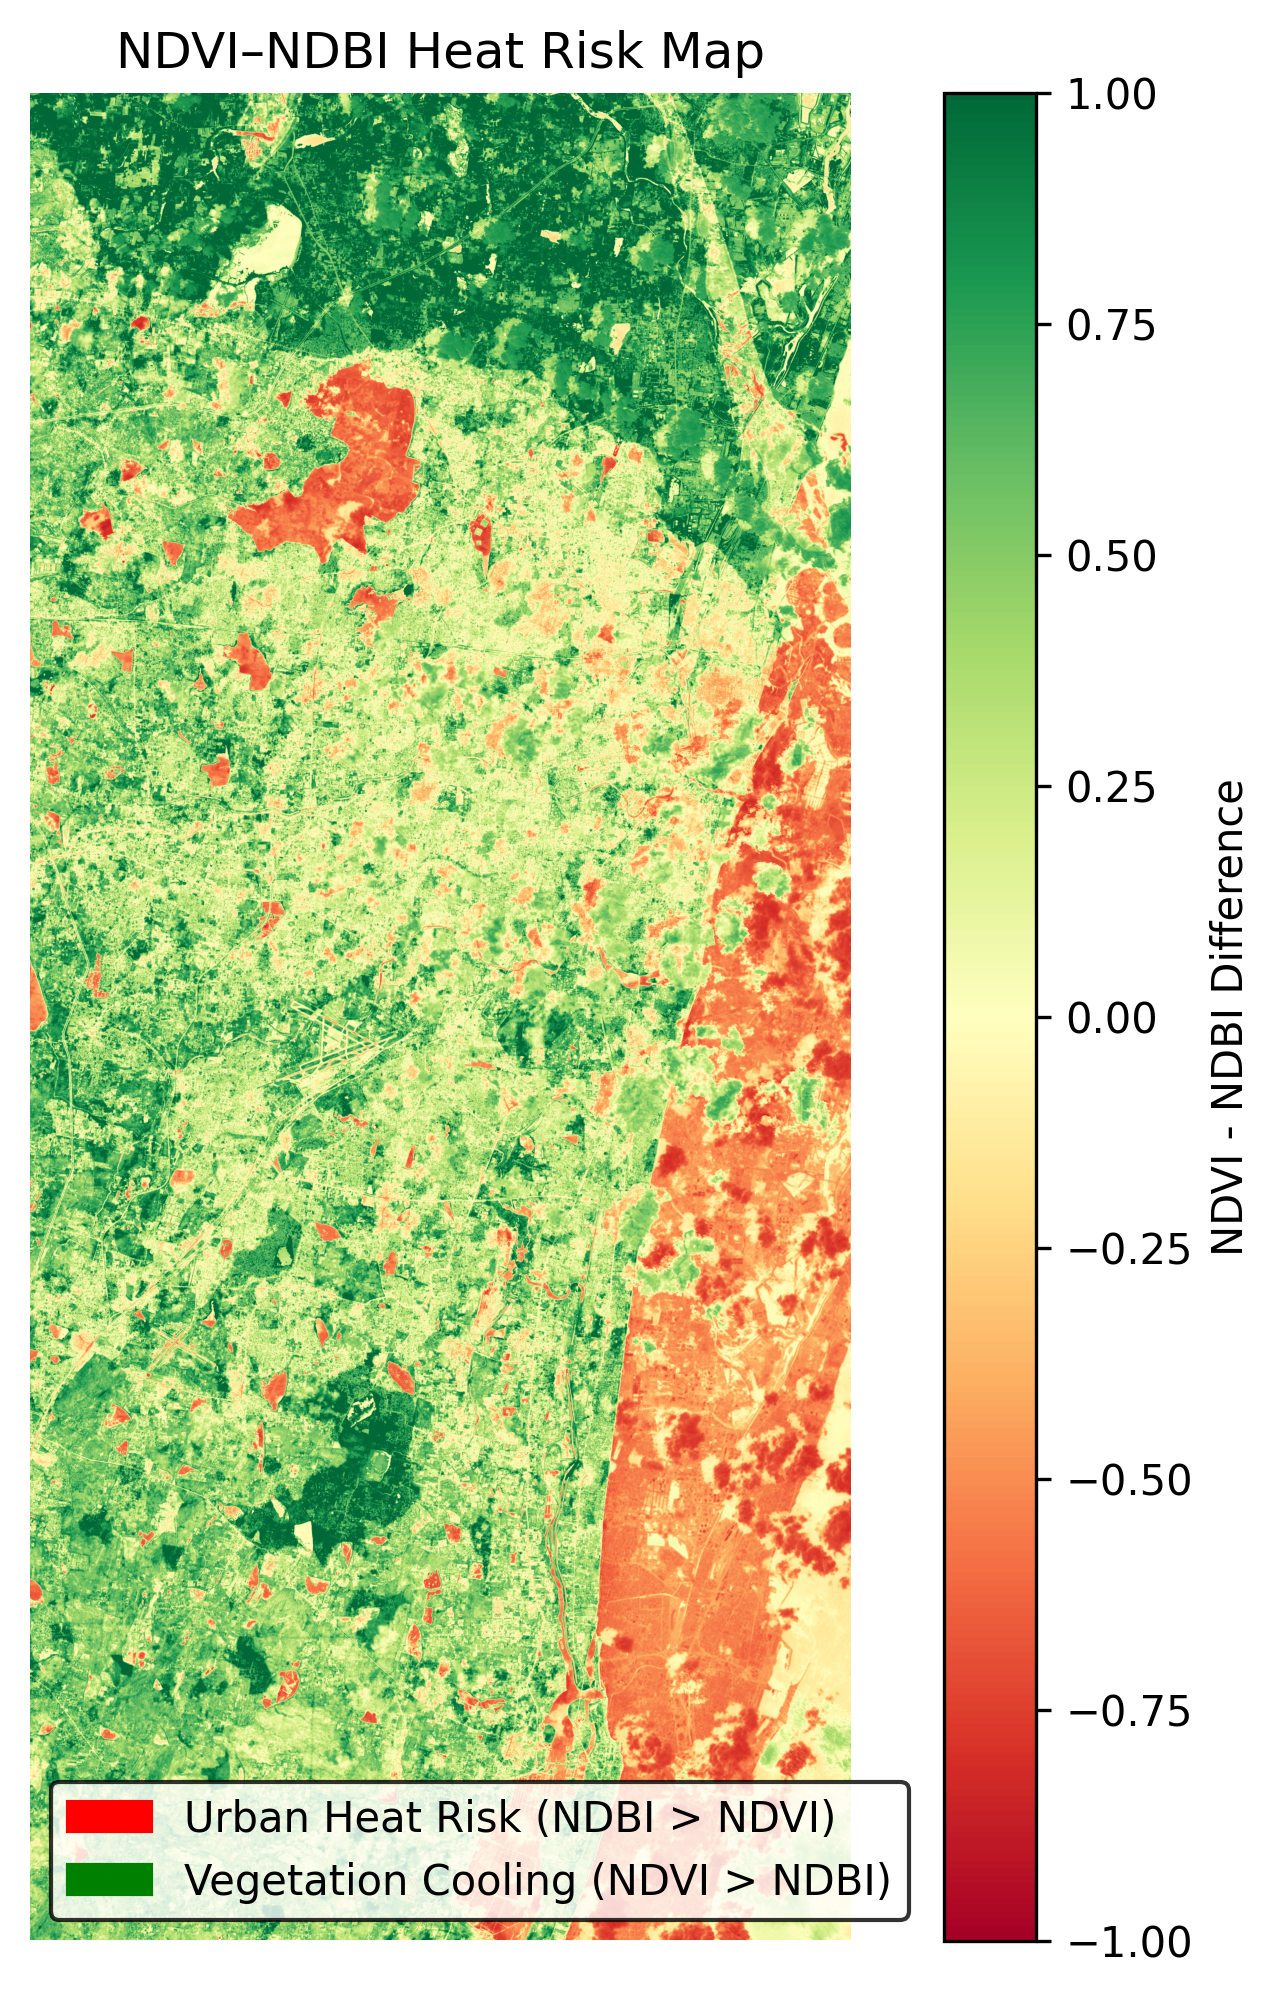
The difference between NDVI and NDBI underscores the balance between nature and urbanization, providing insights into areas where green spaces can be enhanced amidst the concrete jungle. Heat Risk observations, derived from thermal imaging, pinpoint hotspots within the city, emphasizing the need for strategic cooling solutions and green infrastructure. Furthermore, 3D Landscape insights offer a comprehensive view of Chennai's topography, aiding in flood management and urban planning initiatives.
In conclusion, this unified environmental digest for Chennai on September 19, 2025, presents a holistic picture of the city's ecological dynamics. By leveraging these insights, policymakers and urban planners can make informed decisions to foster a sustainable and resilient urban environment for the future.
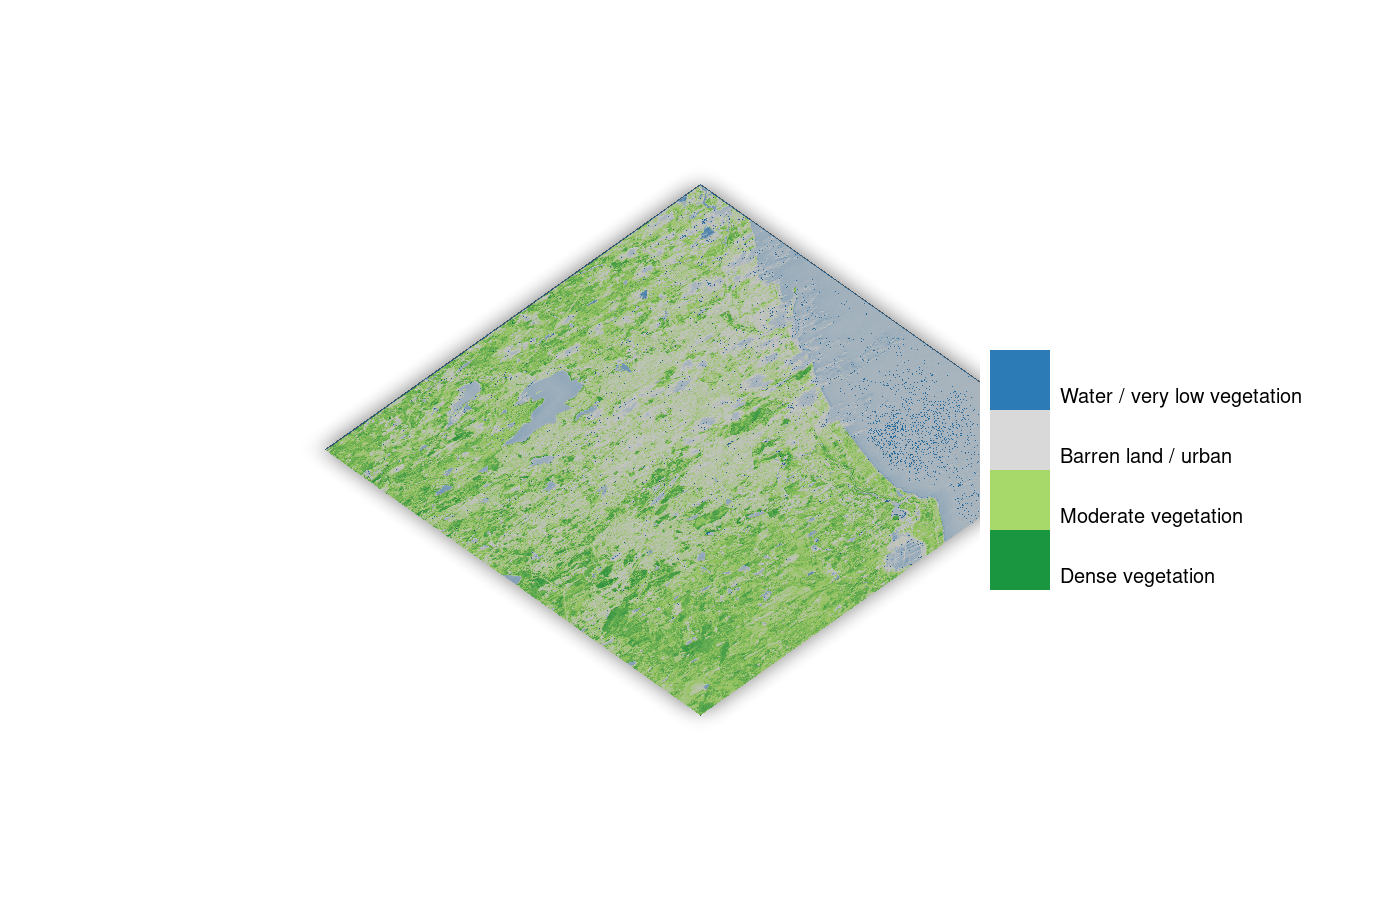
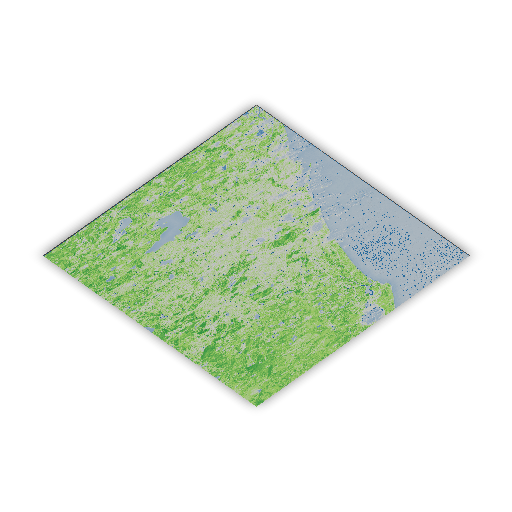
NDVI Analysis
Stats: NDVI CSV
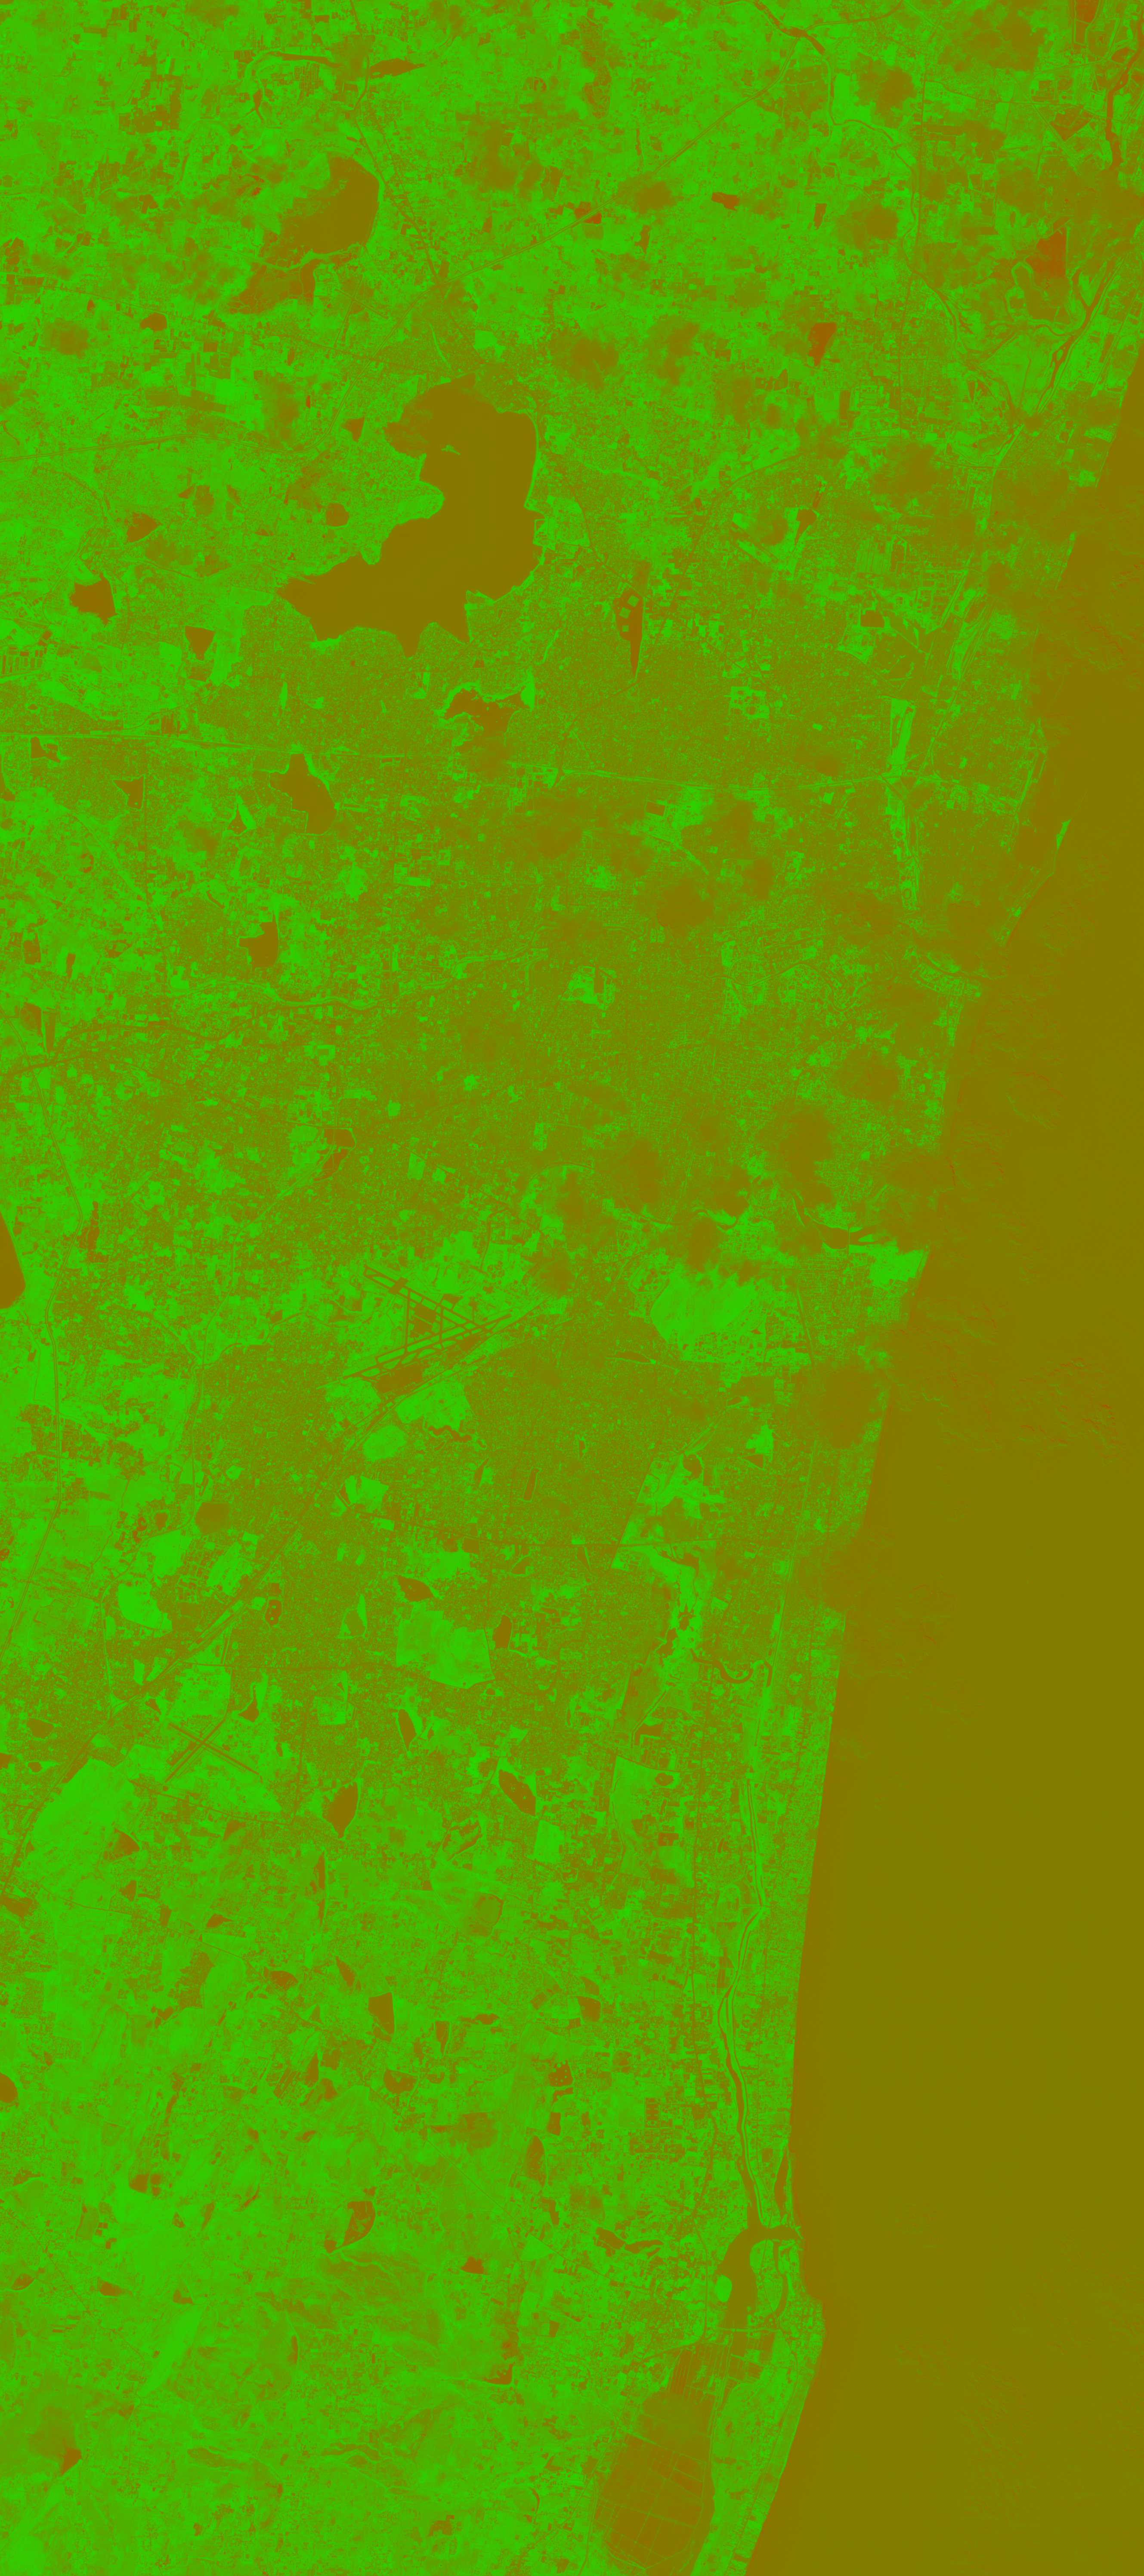
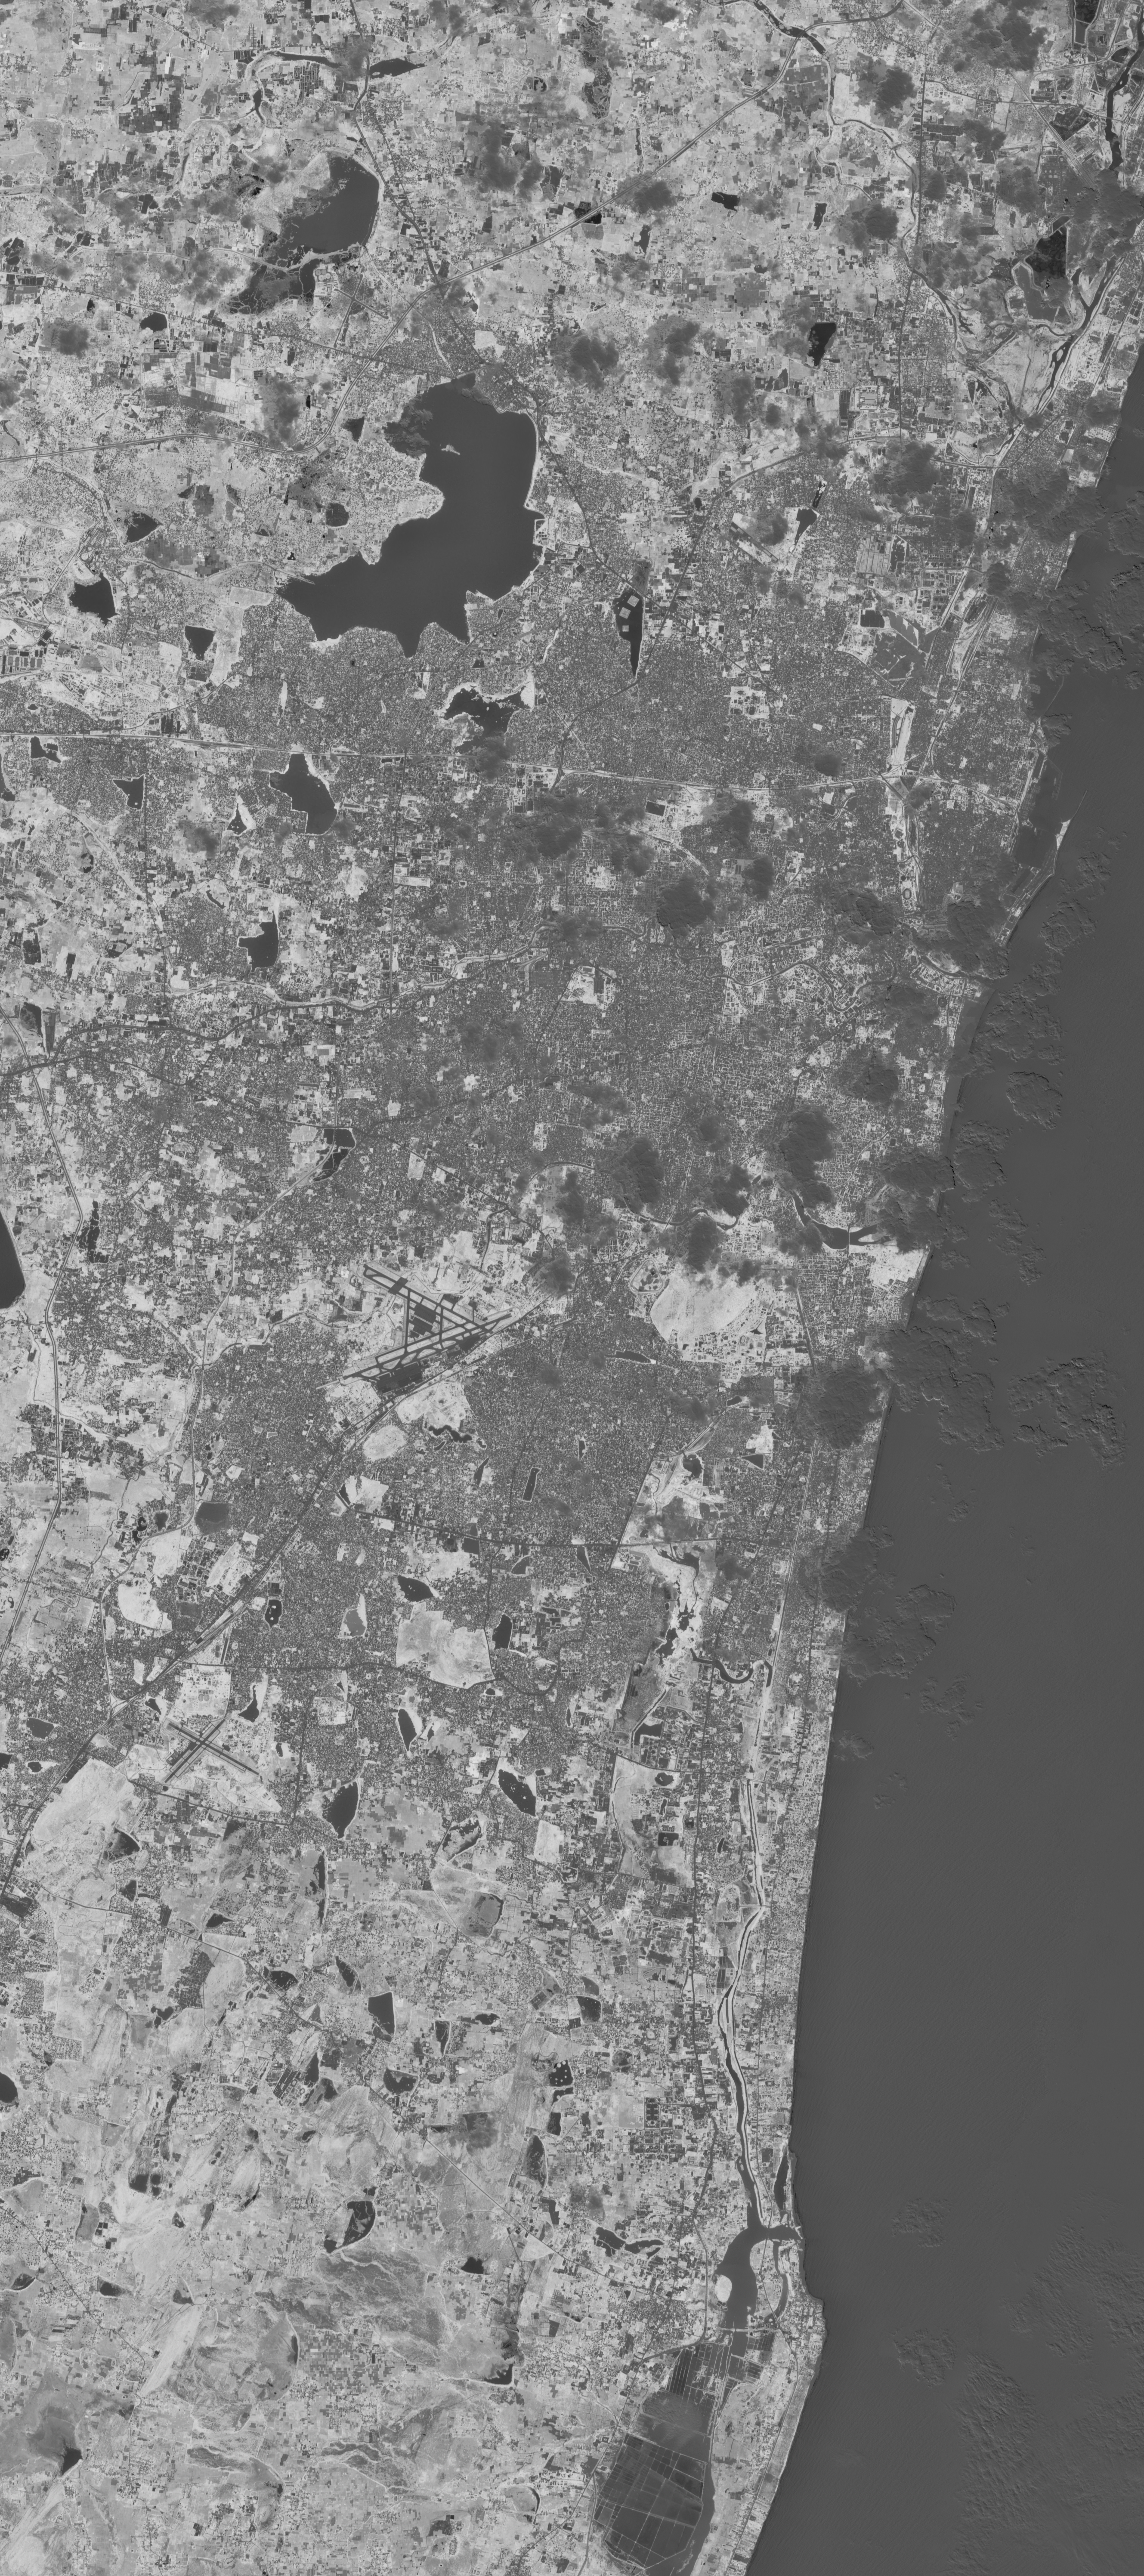
NDBI Analysis
Stats: NDBI CSV
NDVI–NDBI Difference
Stats: Difference CSV
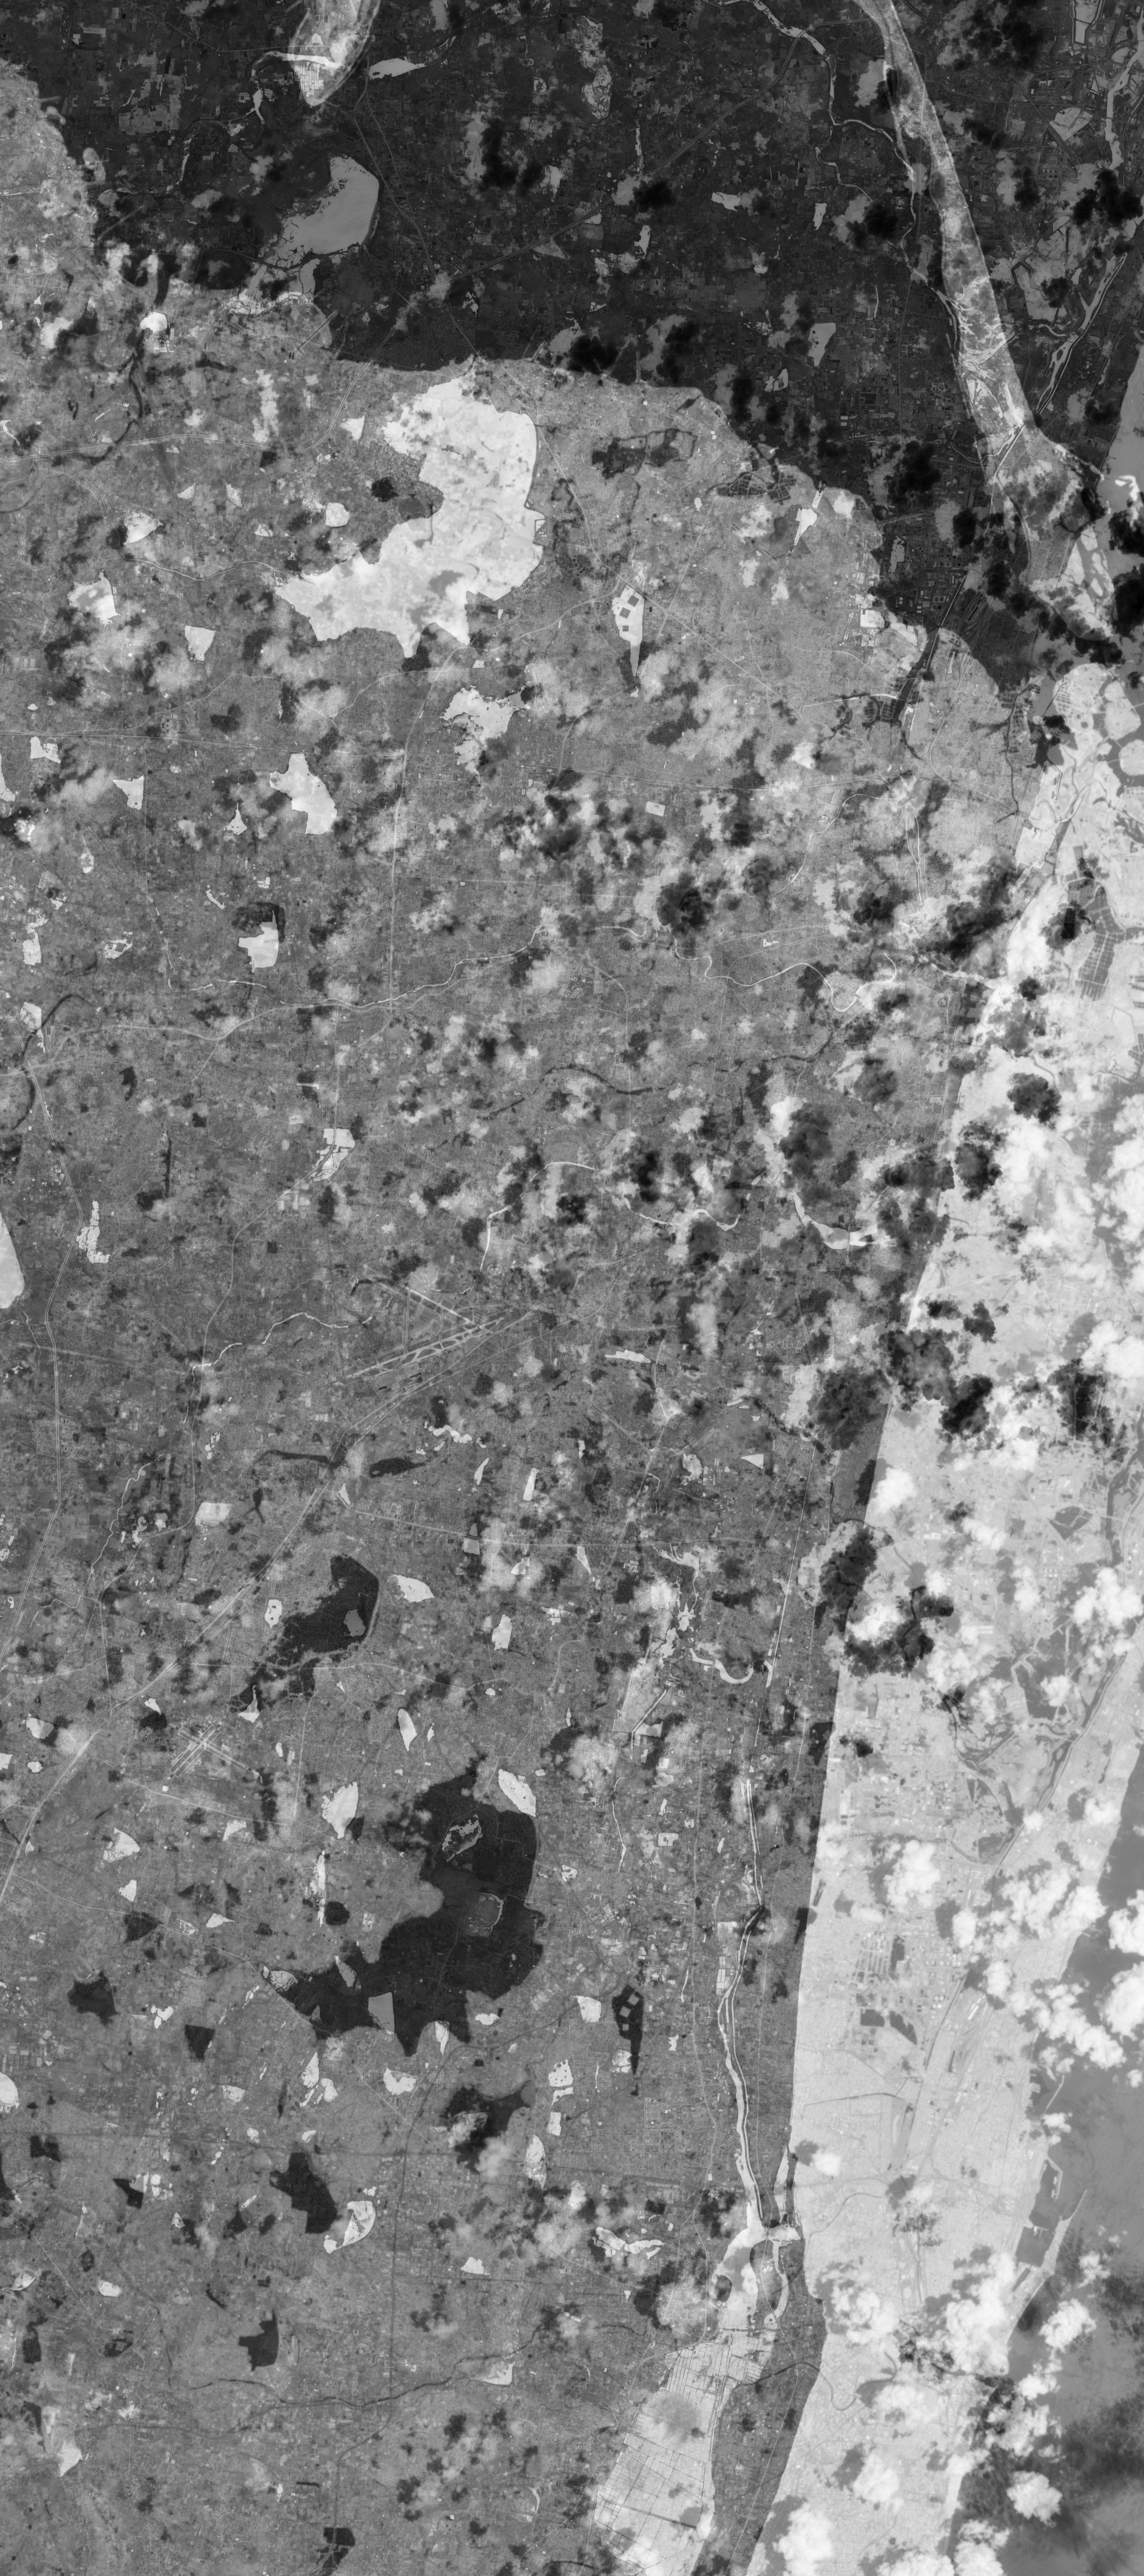
Heat Risk Map
3D Landscape Renders