Urban Green Cover & Built-up Analysis — Chennai-region
Monthly Analysis of City Vegetation for Chennai-region, tracking vegetation health and urban development trends from satellite data. This digest integrates NDVI and NDBI indices, highlights zones of vegetation stress versus built-up surfaces, and assesses urban heat island effect with heat-risk mapping and 3D visualizations.
Published on: 2025-09-23
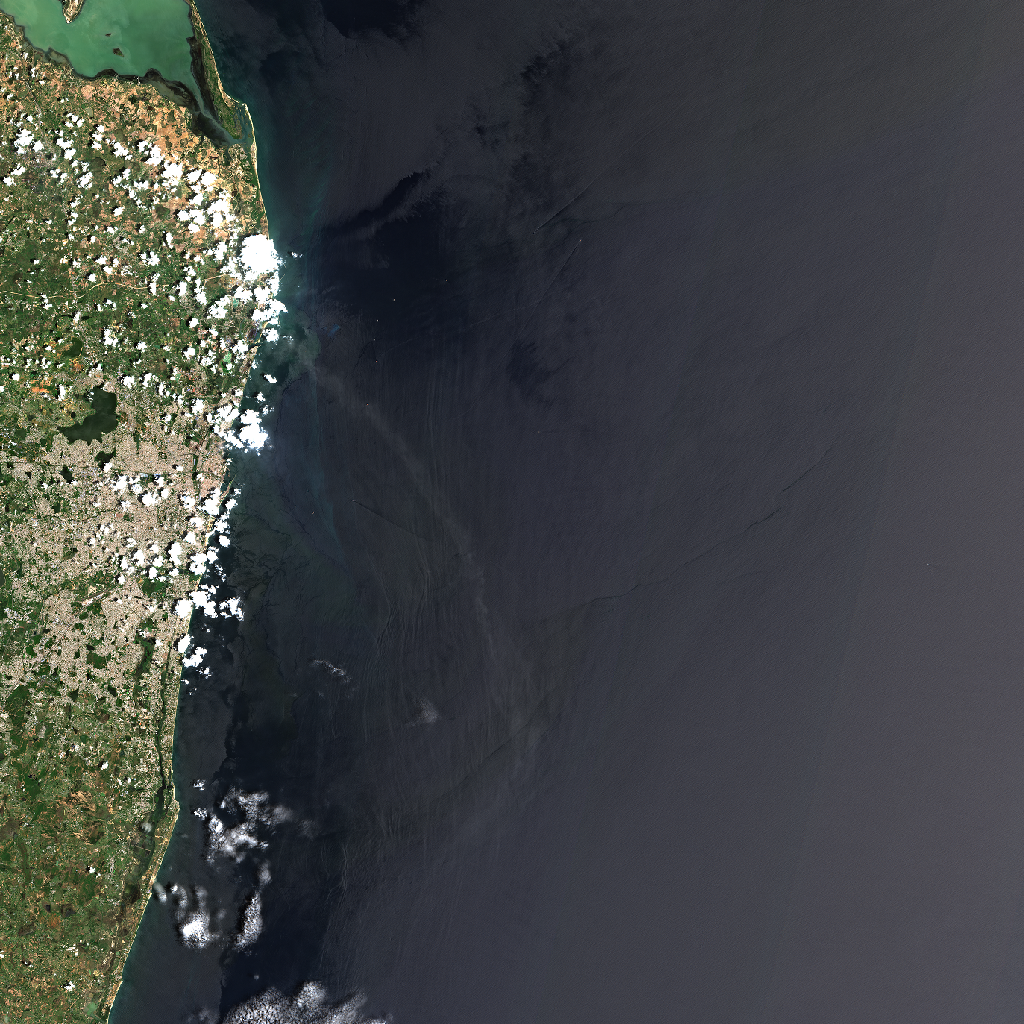
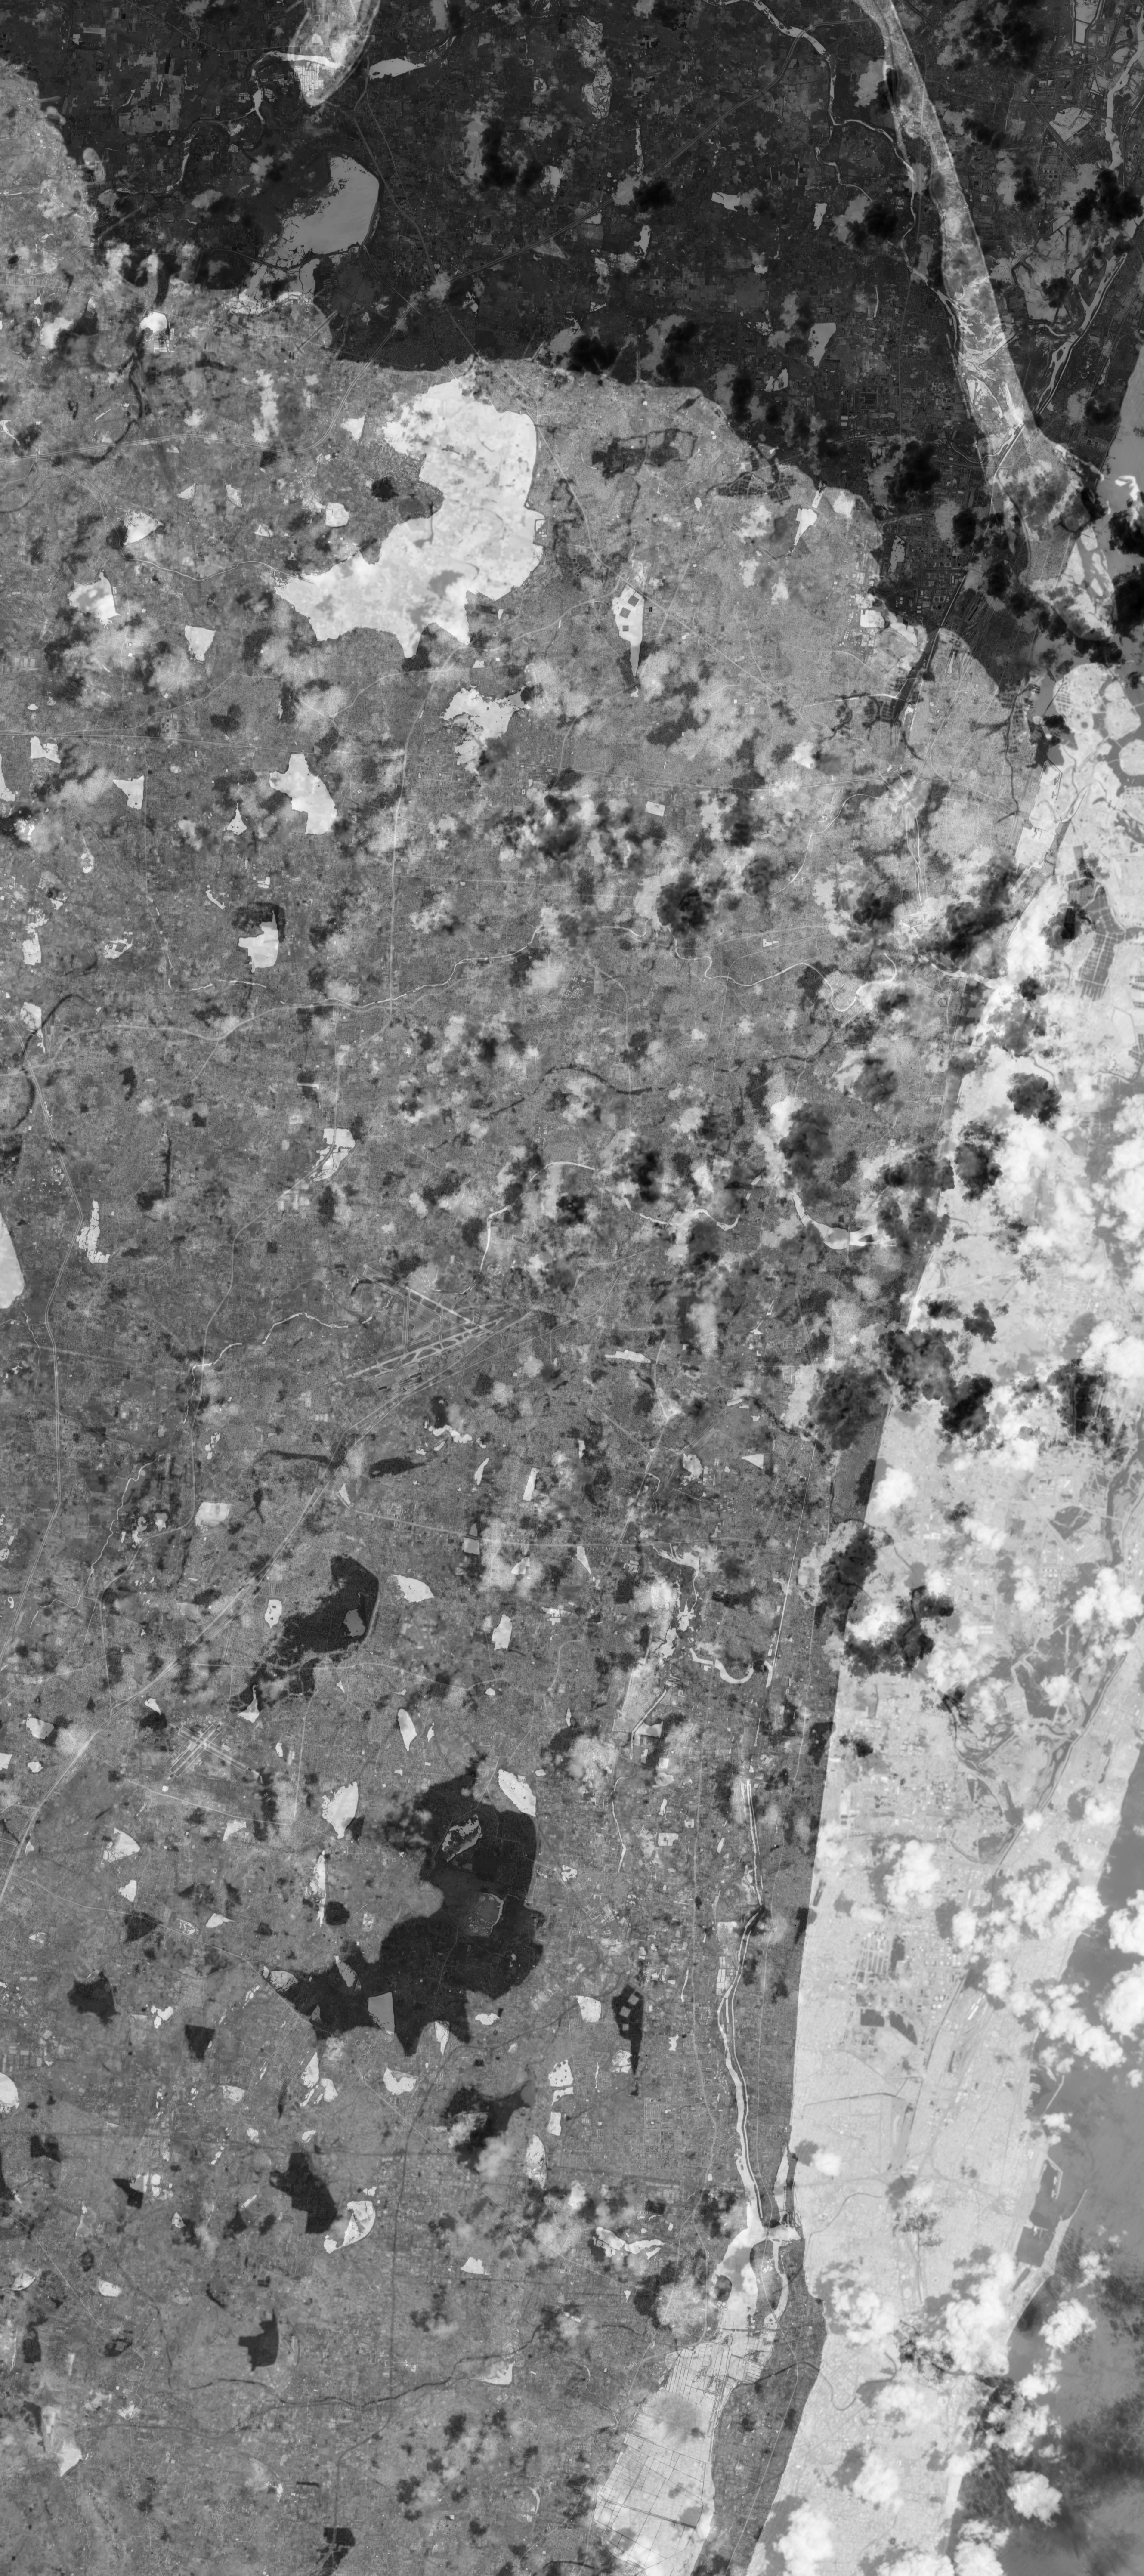
This preview, captured by the Sentinel-2 satellite from its orbit at approximately 786 km above Earth, shows the Chennai region in striking detail. The city lies at the center of the frame, stretching southward along the coast to Mahabalipuram, while in the north the dark green wetlands and inland waters of Pulicat stand out vividly. The contrasting shades highlight both the dense urban core and the surrounding natural landscapes. Imagery observed on 2025-09-08 .
This month's environmental digest for the Chennai region uses Sentinel-2 satellite data to evaluate vegetation health via NDVI (Normalized Difference Vegetation Index) and built-up intensity through NDBI (Normalized Difference Built-up Index). Only images with cloud cover below 50% are considered, with this digest produced monthly to capture meaningful changes. Sourced from the Microsoft Planetary Computer, our analysis reveals a region where vegetation slightly edges out built-up surfaces, offering a nuanced view of urban versus green spaces.
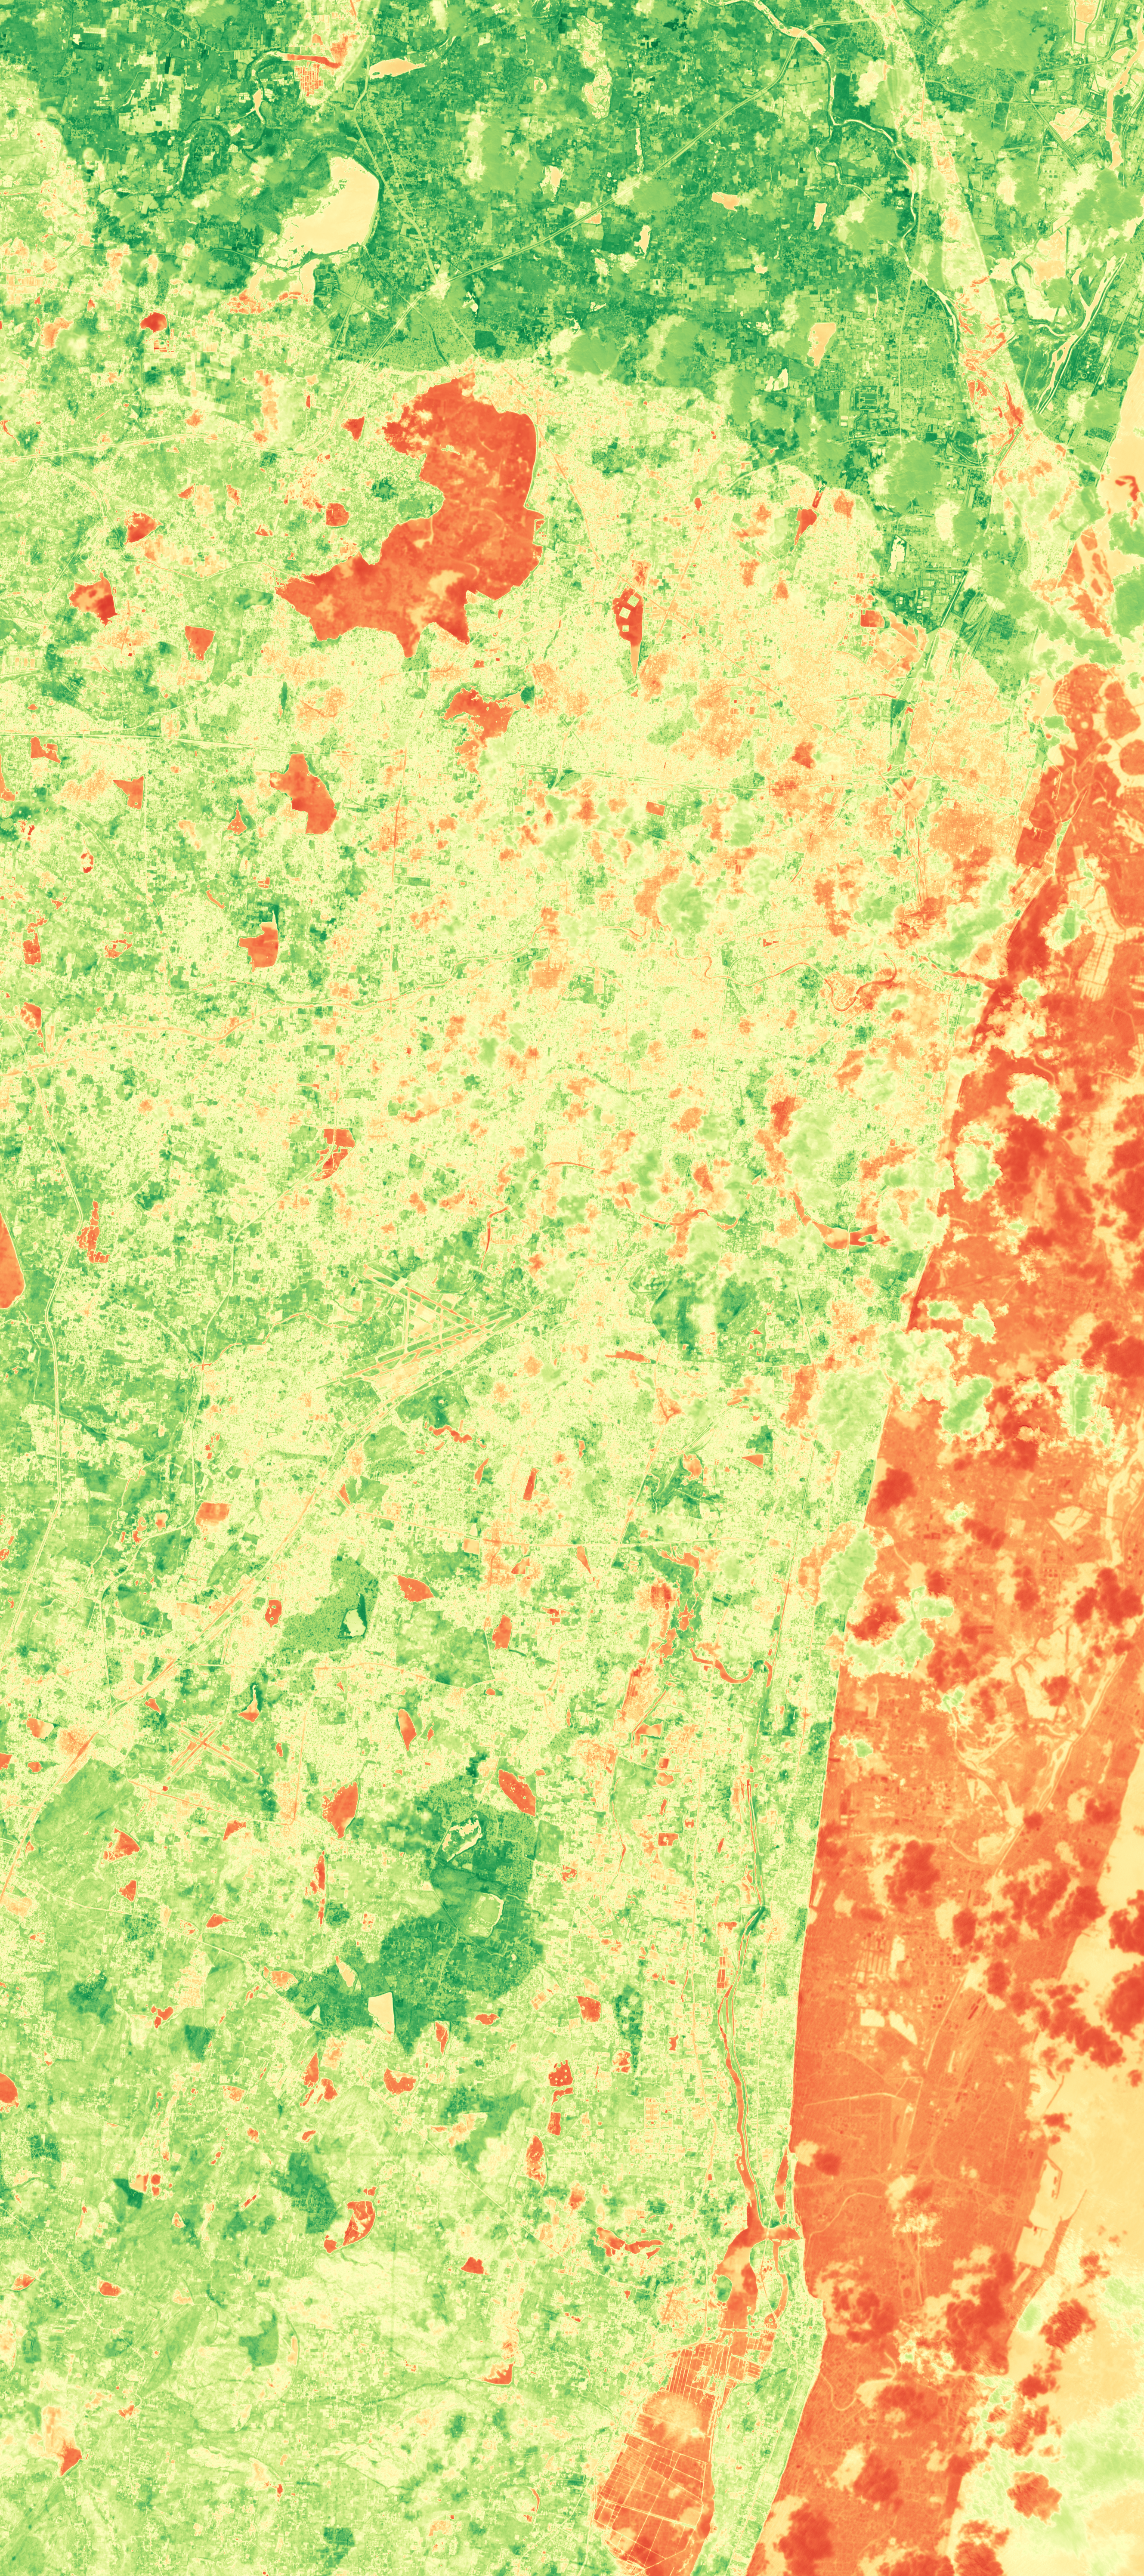
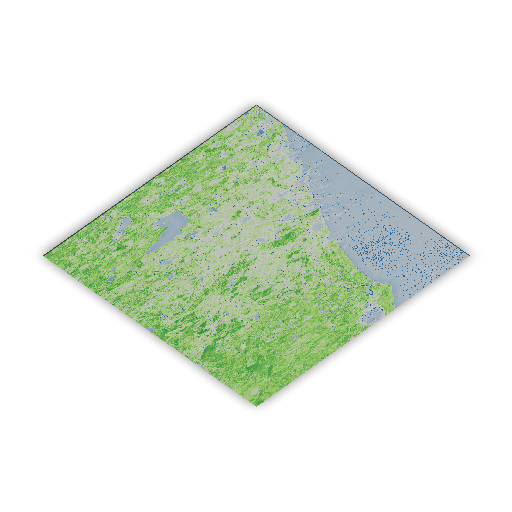
NDVI
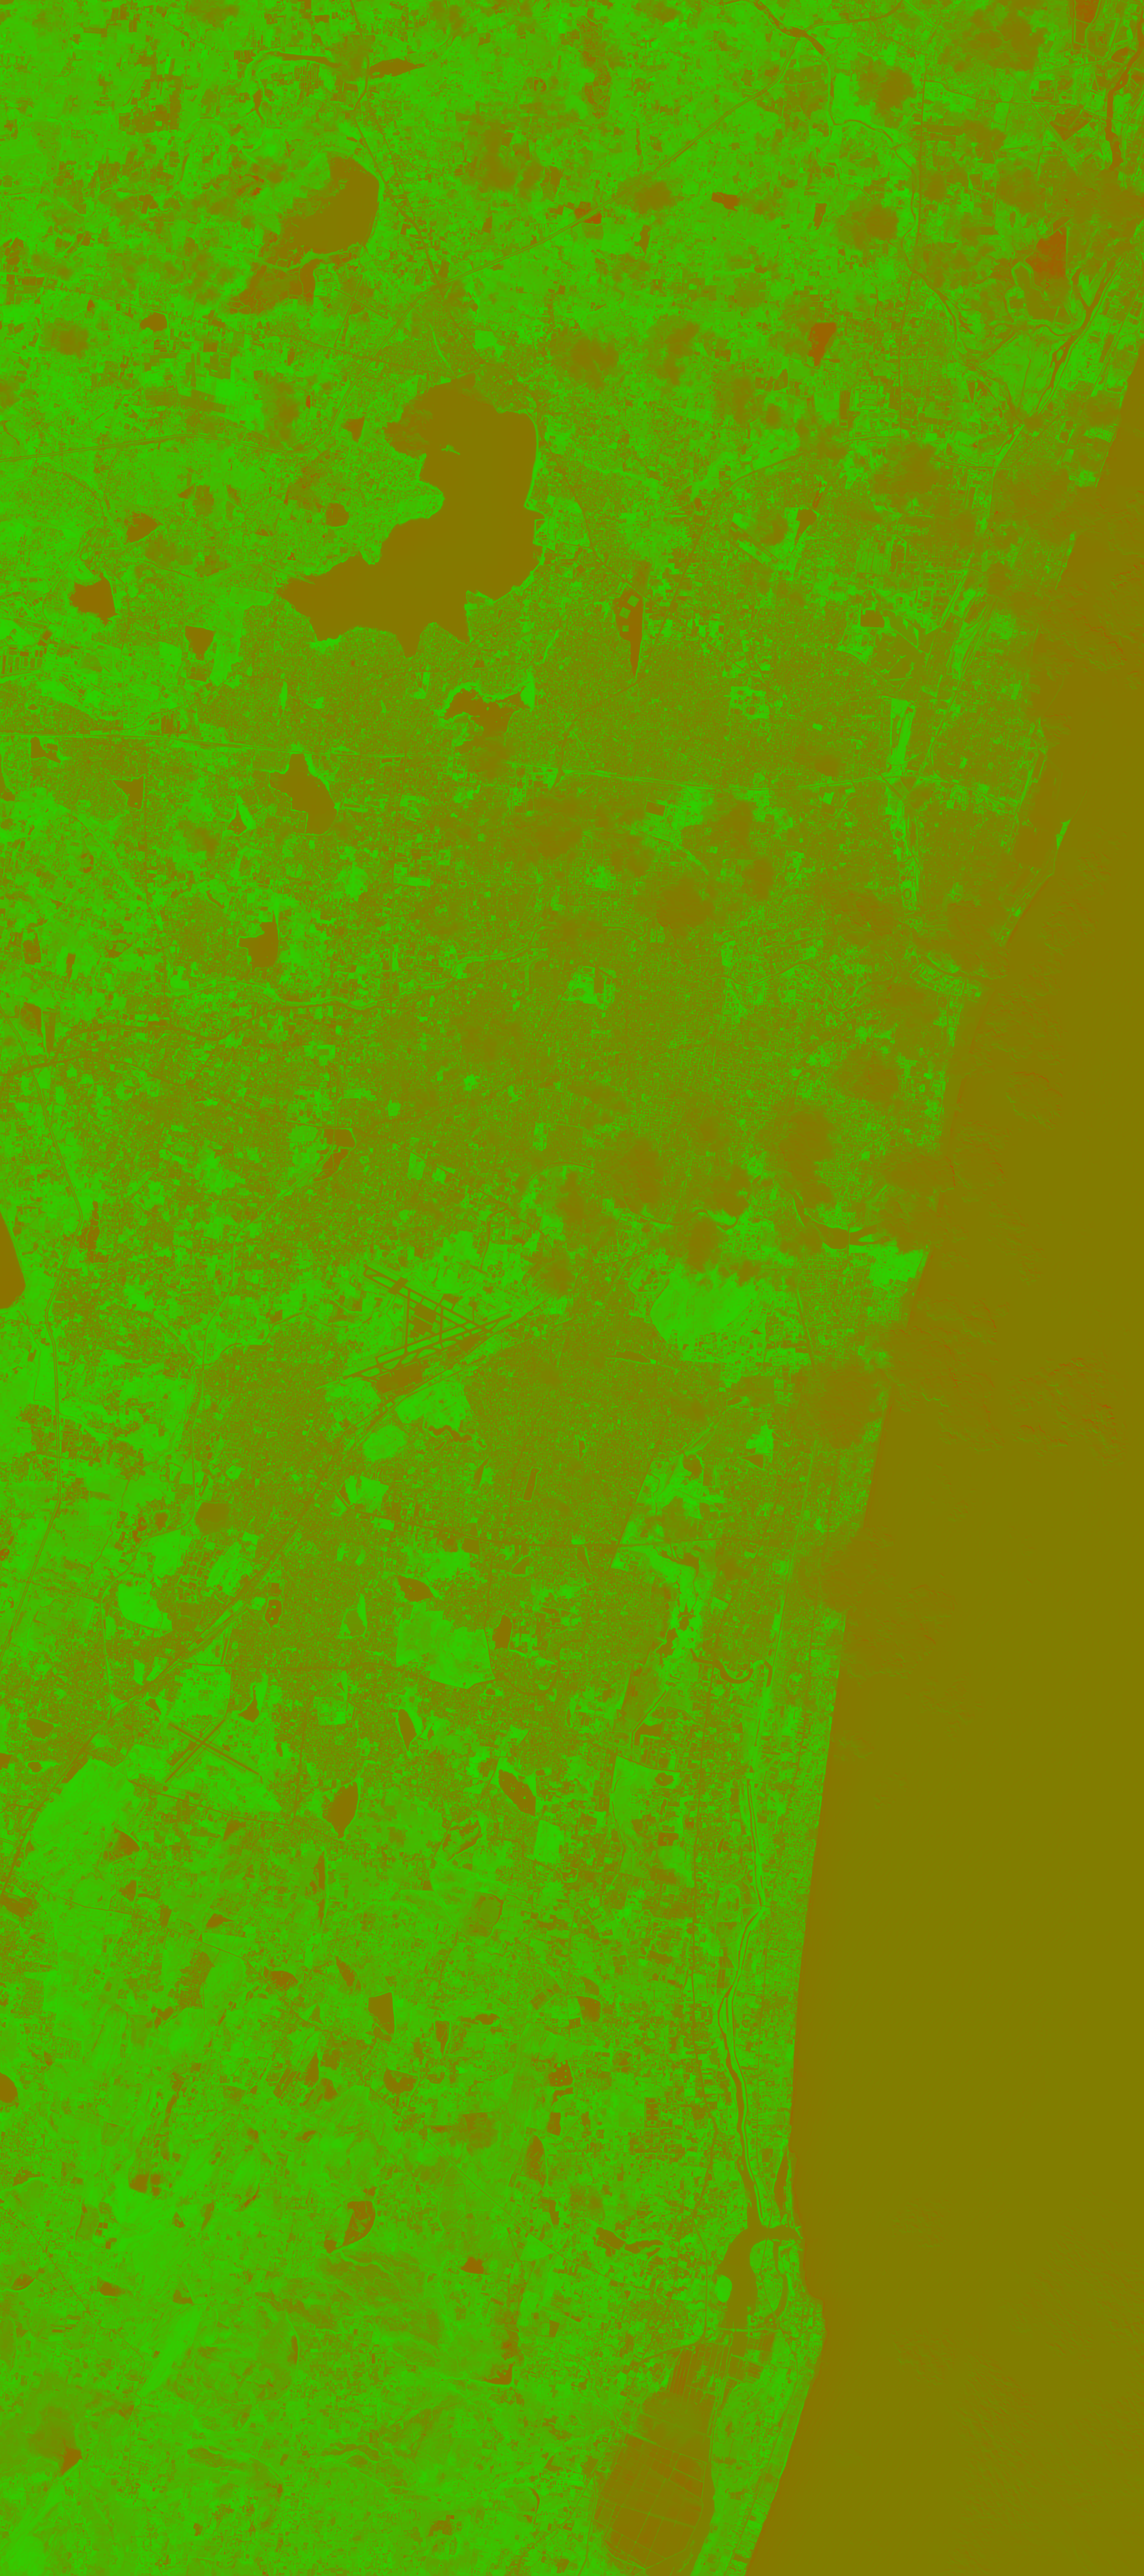
NDVI — color visualization
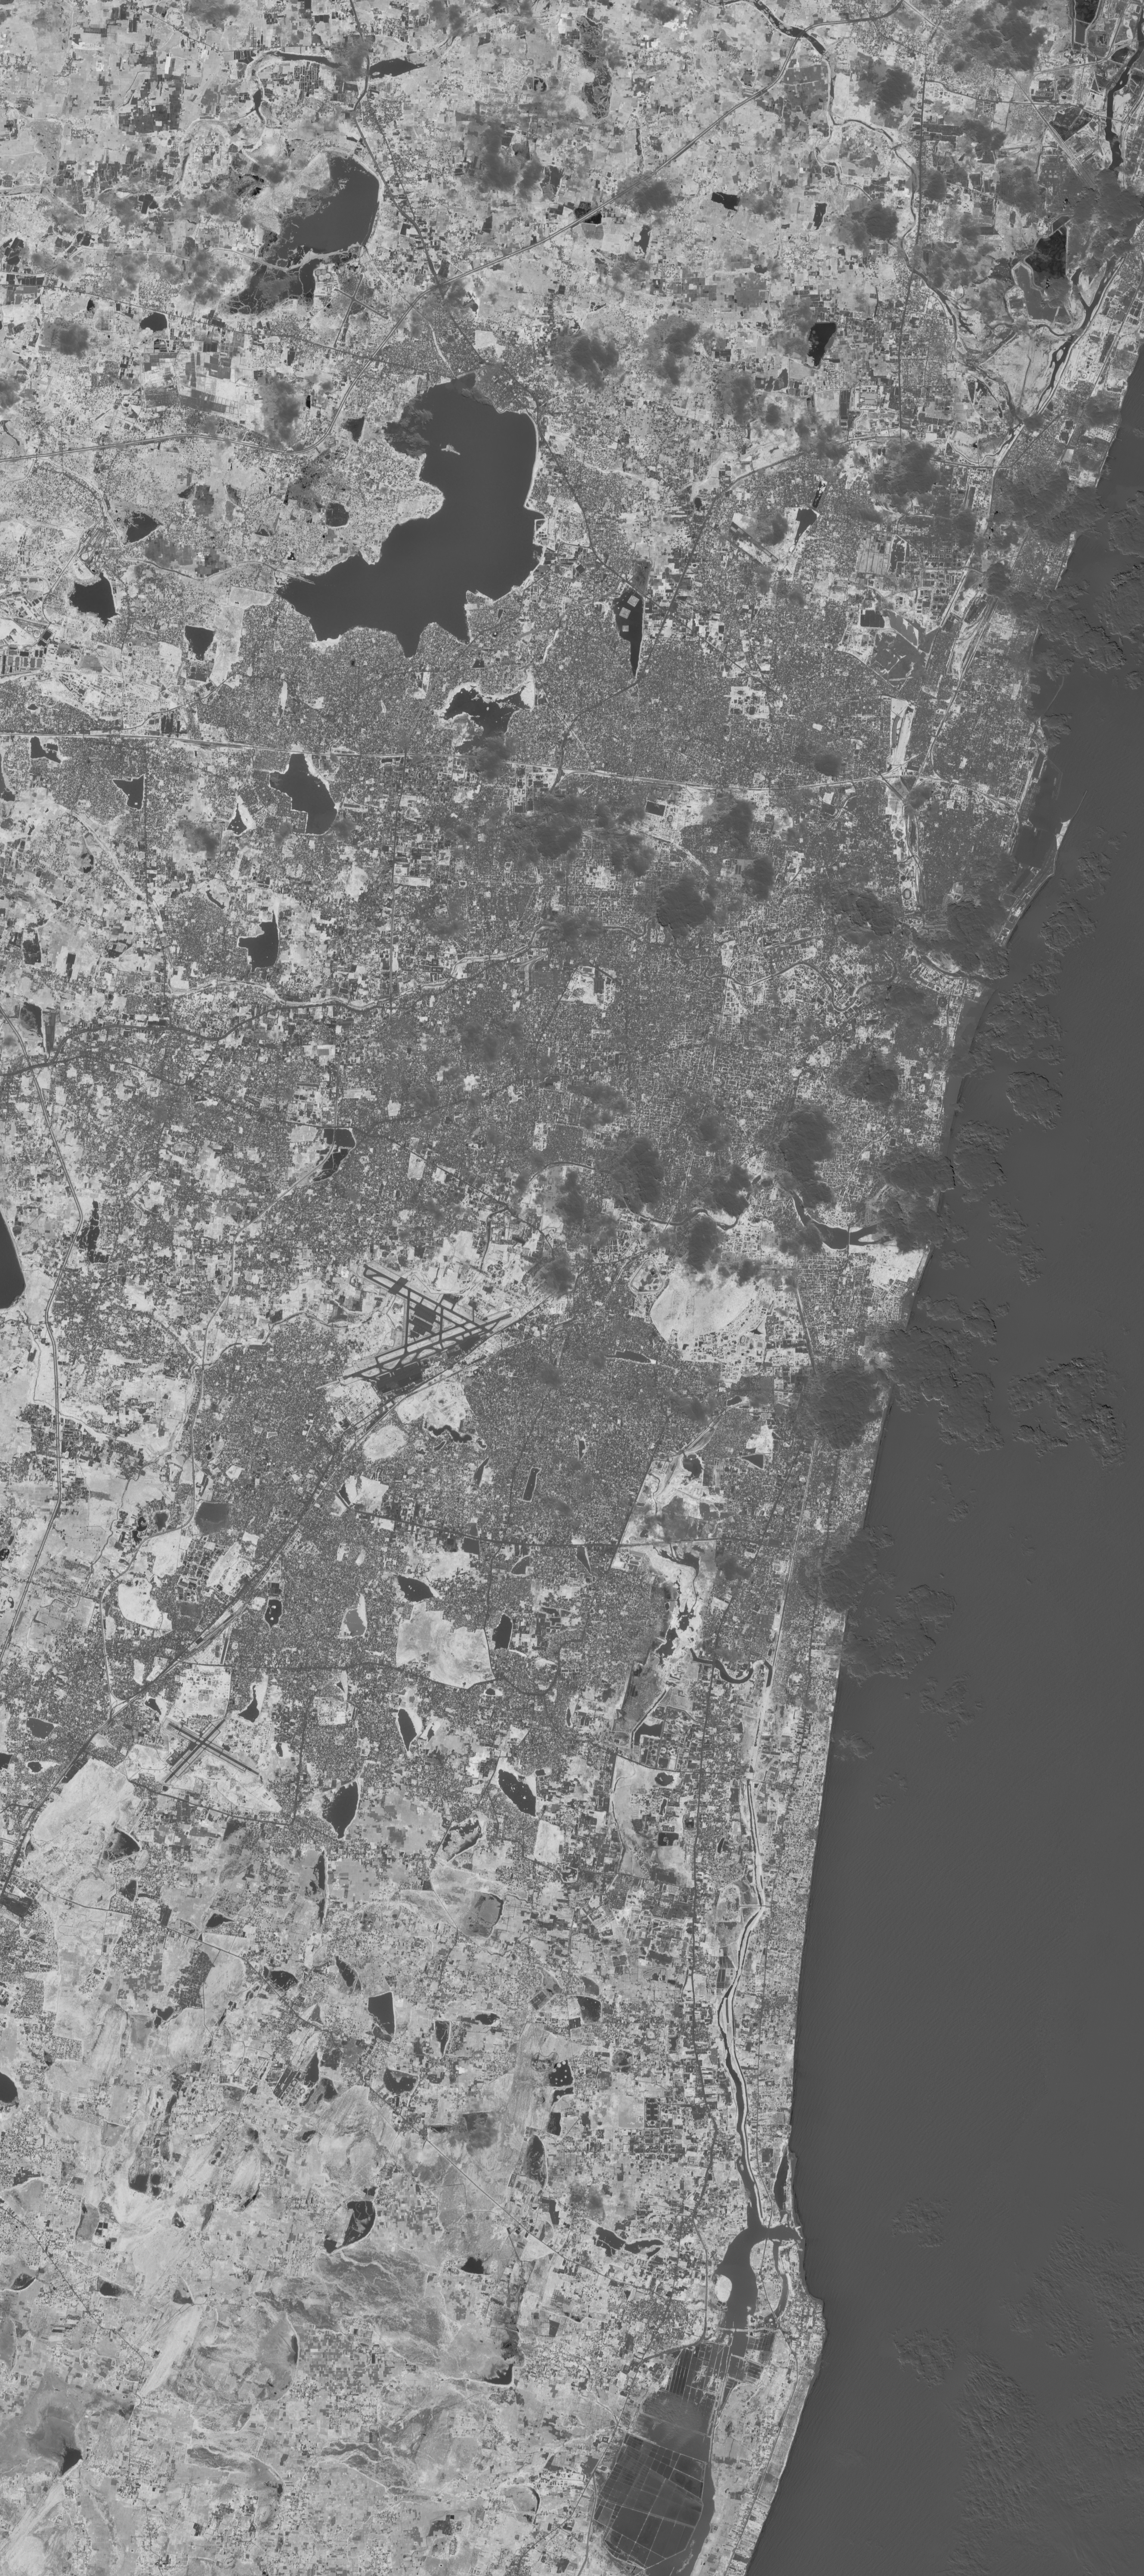
NDVI — greyscale (index values)
NDVI csv values
| min | max | mean | median | stddev |
|---|---|---|---|---|
| -0.4485921859741211 | 0.8750731348991394 | 0.21547739207744598 | 0.186454176902771 | 0.20326893031597137 |
NDBI (Built-up Index)
NDBI — color visualization
NDBI — greyscale (index values)
NDBI csv values
| min | max | mean | median | stddev |
|---|---|---|---|---|
| -0.8564348220825195 | 0.845417320728302 | -0.03905818983912468 | -0.0476665124297142 | 0.3333911895751953 |
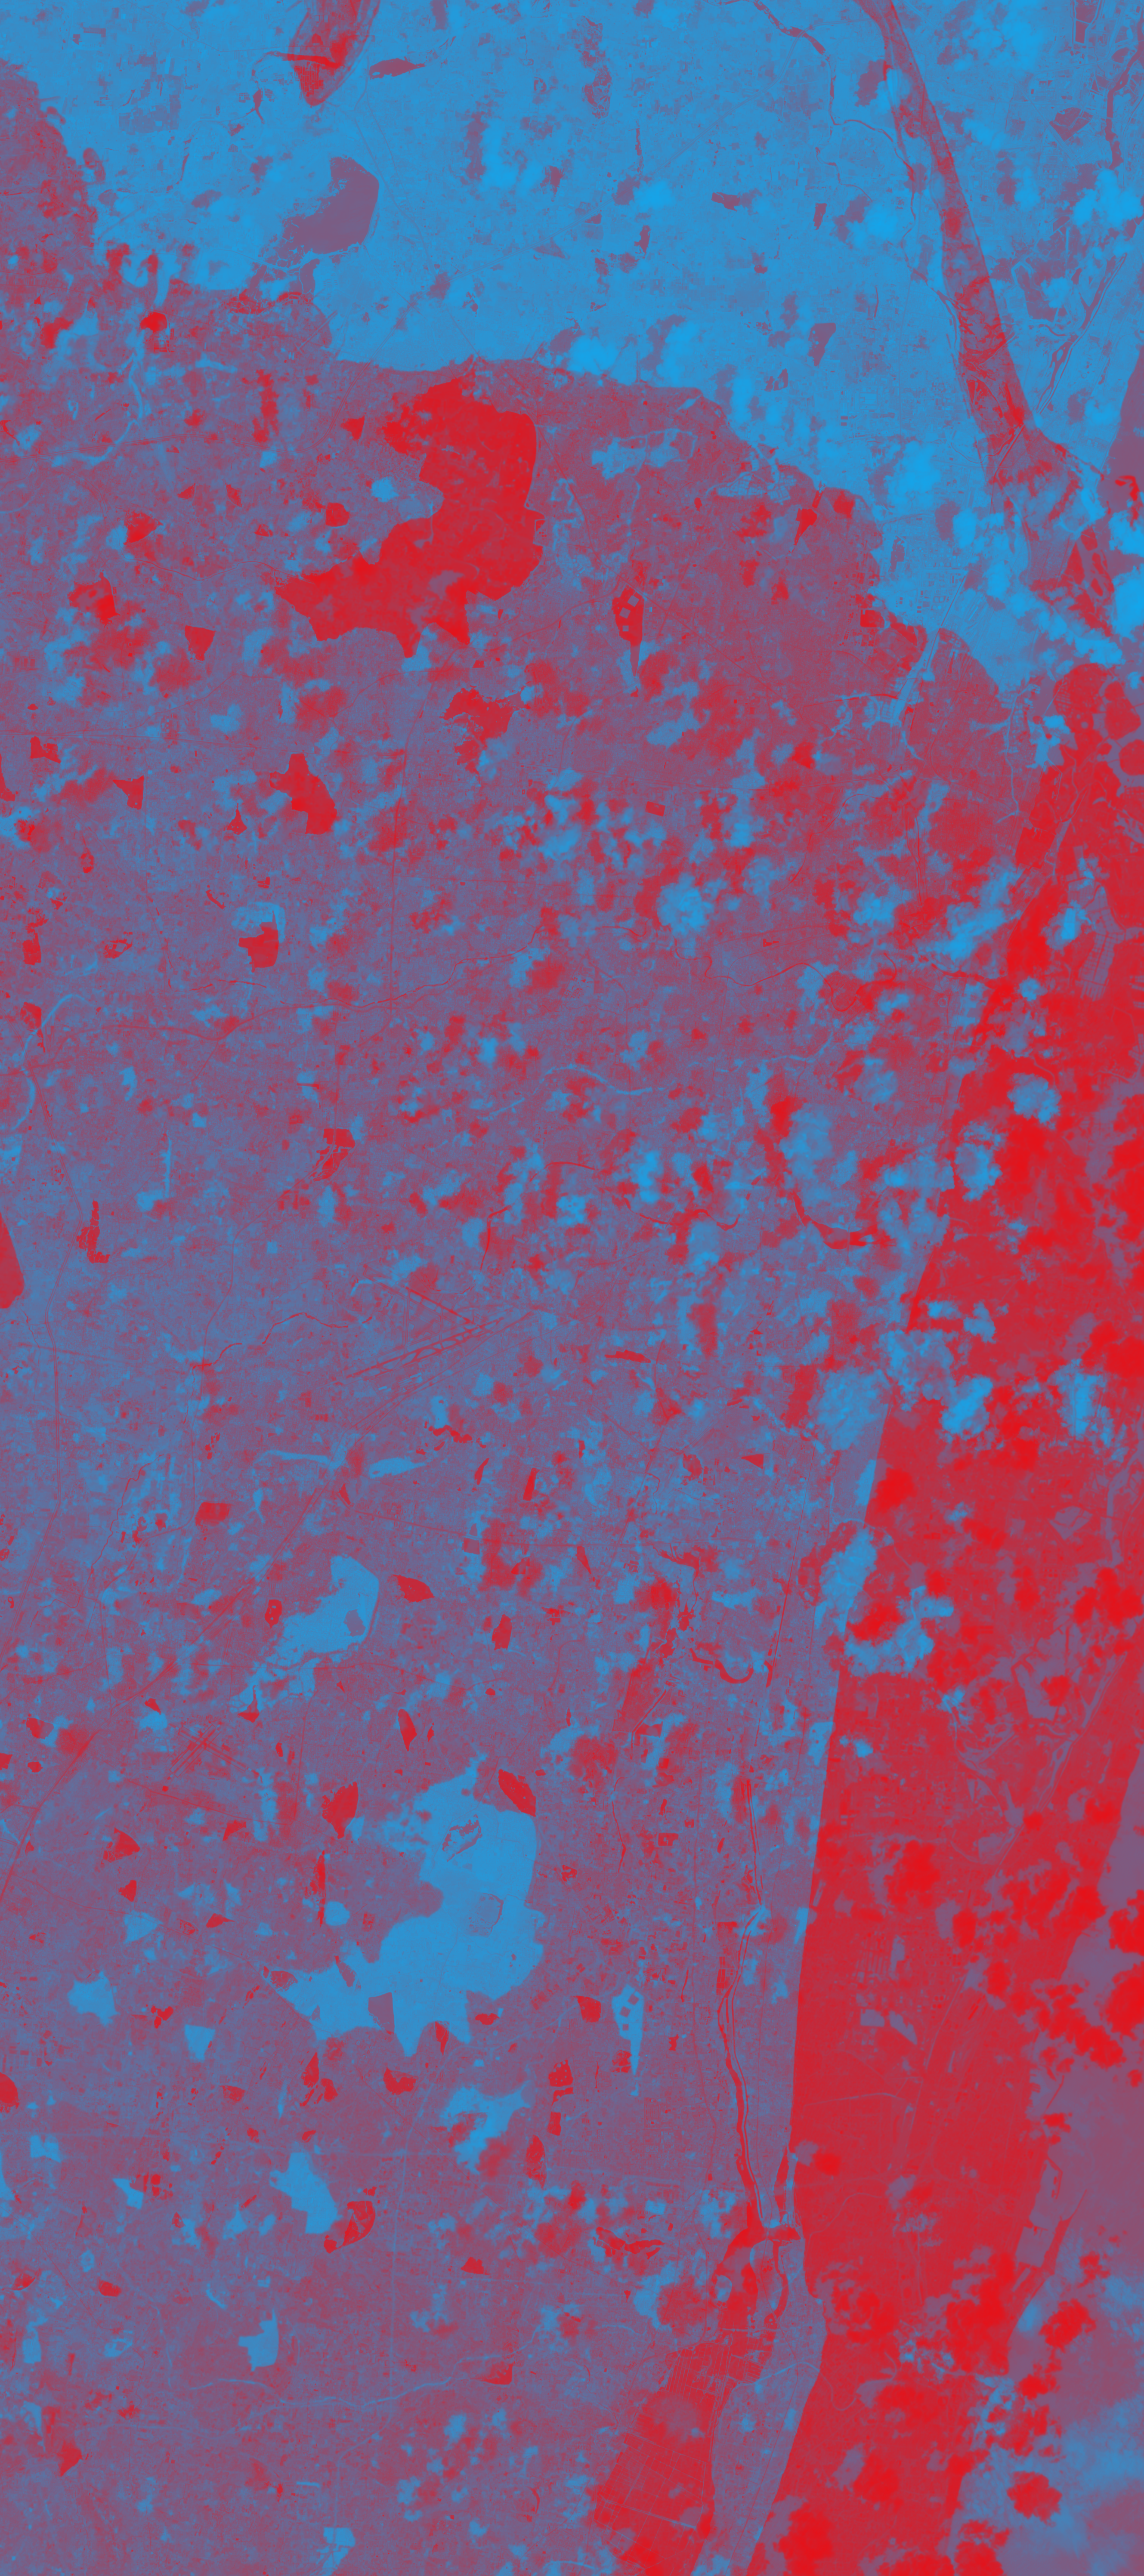
NDVI − NDBI & Heat Risk
Difference visualization — highlights vegetation vs built-up dominance.
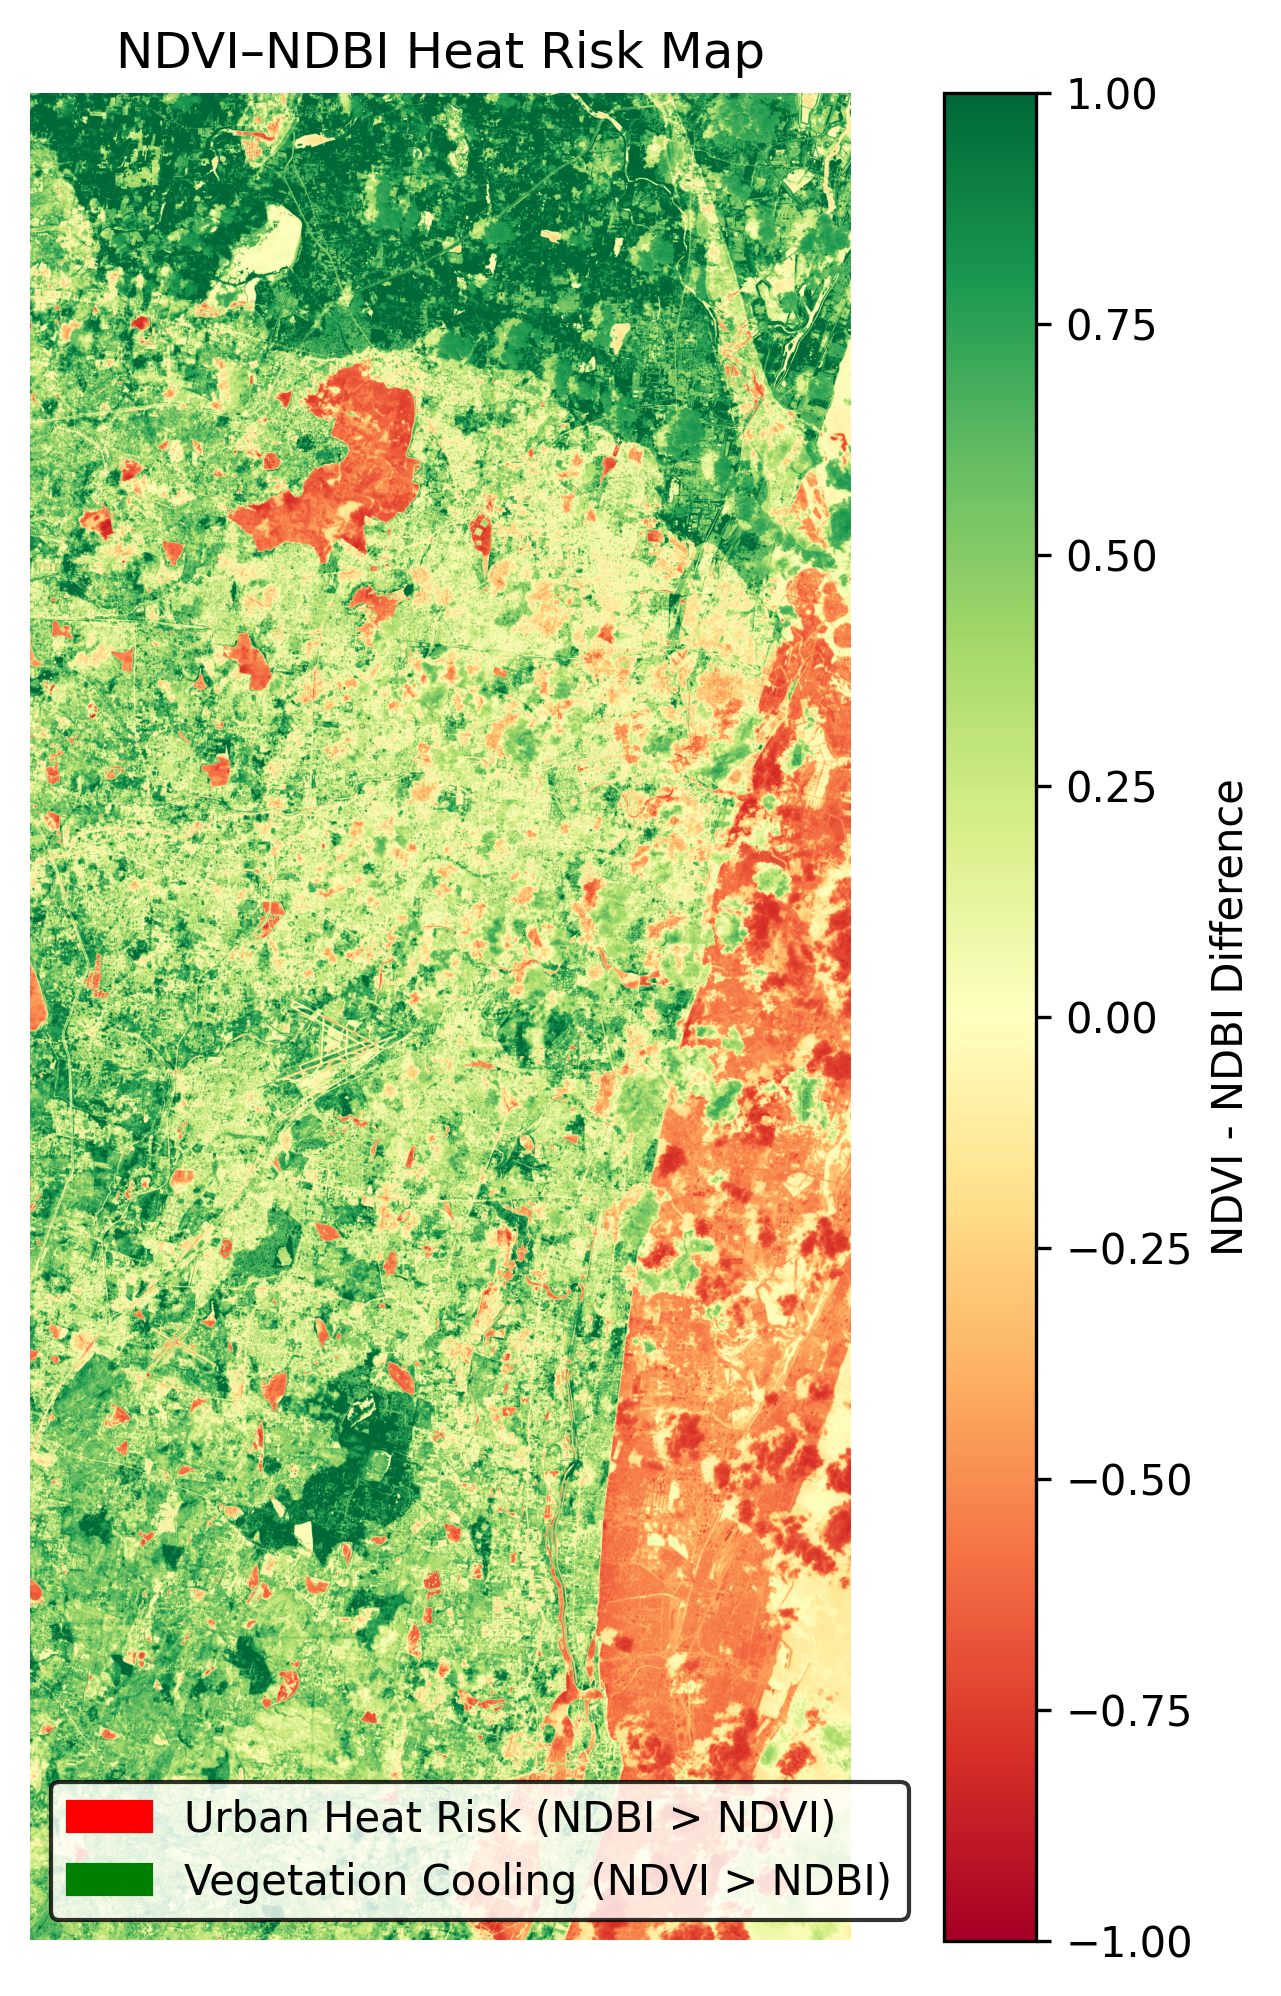
Heat risk interpretation derived from NDVI–NDBI difference.
The NDVI readings for Chennai show a minimum value of -0.449, a maximum of 0.875, a mean of 0.215, a median of 0.186, and a standard deviation of 0.203. An average NDVI of 0.215 indicates moderate tree and vegetation cover across the region. The NDBI values range from a minimum of -0.856 to a maximum of 0.845, with a mean of -0.039 and a median of -0.048. The negative mean and median NDBI suggest that vegetation and open areas are more prevalent than built-up surfaces, though the high maximum value points to localized built-up hotspots.
Comparing NDVI and NDBI, the mean difference (NDBI - NDVI) is -0.254, indicating that vegetation predominates over built-up surfaces in Chennai. This difference is visualized in the NDVI–NDBI difference map, where areas with NDVI greater than NDBI are marked in green, suggesting cooling effects, while areas where NDBI exceeds NDVI are highlighted in red, indicating increased urban heat risk (see ndvi_ndbi_diff_color.png).
- Focus urban cooling efforts on areas where NDVI significantly exceeds NDBI.
- Monitor and possibly mitigate heat in built-up hotspots where NDBI is high.
- Consider vegetation corridors in urban planning to enhance cooling effects.
3D Renders (Rayshader & Rayrender)
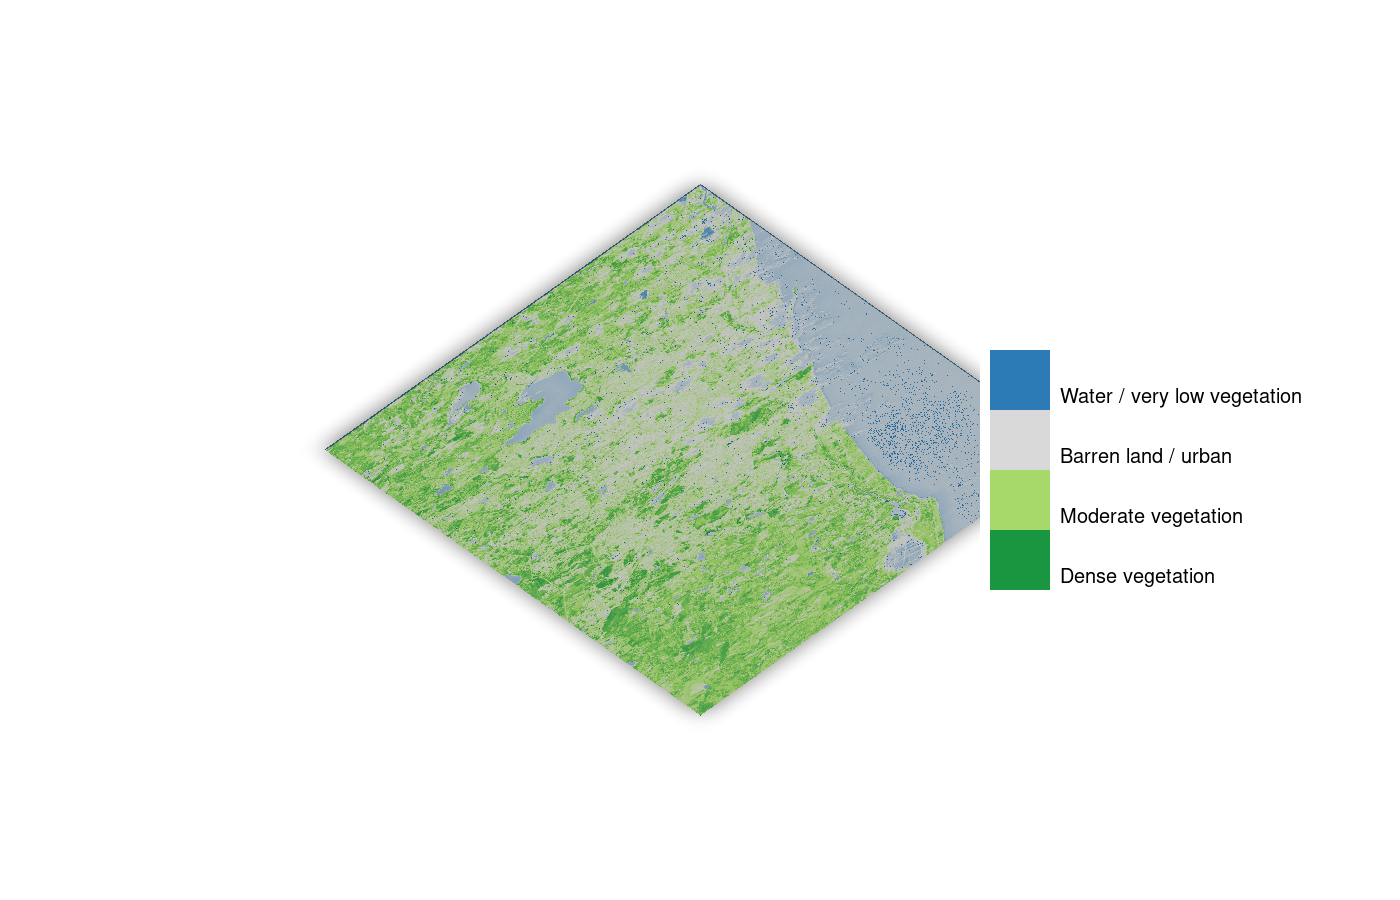
Rayshader 3D visualization derived from NDVI height-extrusion
Rayrender 3D visualization derived from NDVI height-extrusion
Interactive NDVI overlay (zoom, pan, transparency). Use it alongside the static maps above.
To explore the data further, use the interactive overlay available at ndvi_map.html. Here, you can zoom in on specific areas, adjust the transparency slider for better layer comparison, and validate features against high-resolution basemaps. Remember, the analysis is limited by the cloud cover percentage noted in the metadata. We recommend field validation and suggest a monthly monitoring cadence to track changes effectively.
Urban heat island effect
Our analysis indicates that vegetation slightly predominates over built-up surfaces in the Chennai region, with a mean difference of -0.254. This suggests a generally cooler urban environment, though attention should be paid to areas where built-up surfaces are dense, as these pose higher heat risks. We recommend a monthly monitoring cadence to observe changes, prioritize urban greening projects, and engage the community in cooling initiatives.
Disclaimer: this analysis refers to the satellite crop / geo-bounds stored under the 'Chennai-region' folder (may include extended suburbs) and does not represent the full administrative limits of Chennai.
References & Data
Free to Download (Please cite):
I Hug Trees NDVI Data Citation:
The NDVI and NDBI GeoTIFF and images are provided by I Hug Trees for scientific purposes. Please cite as:
    @misc{ihugtrees_ndvi_2025,
      author    = {I Hug Trees},
      title     = {NDVI and NDBI Analysis Data - Chennai region 2025},
      year      = 2025,
      note      = {GeoTIFF and images provided for scientific purposes},
      url       = {https://ihugtrees.org}
    }
Microsoft Planetary Computer Citation
If the Planetary Computer is useful for your work, please cite it using this record on Zenodo:
    @software{microsoft_open_source_2022_7261897,
      author       = {Microsoft Open Source and
                      Matt McFarland and
                      Rob Emanuele and
                      Dan Morris and
                      Tom Augspurger},
      title        = {microsoft/PlanetaryComputer: October 2022},
      month        = oct,
      year         = 2022,
      publisher    = {Zenodo},
      version      = {2022.10.28},
      doi          = {10.5281/zenodo.7261897},
      url          = {https://doi.org/10.5281/zenodo.7261897}
    }