I Hug Trees Logo

Hug Analytics

Satellite-powered insights into urban forestry and green cover change

Real-time NDVI insights and building towards AI-powered green analytics

What is Hug Analytics?

Hug Analytics at I Hug Trees is in a nascent stage and is being nurtured with accuracy, transparency, and a commitment to the true source of data and analytics.

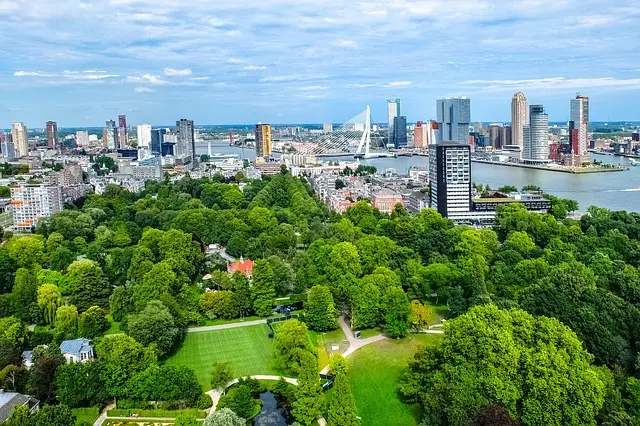
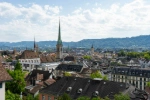
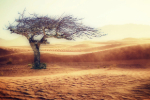
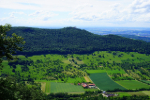
Hug Analytics makes geospatial satellite imagery and environmental analytics accessible to everyone. Using Sentinel-2 data, we calculate NDVI greenness and NDBI urbanization indices to track vegetation cover, canopy density, and shifts in city landscapes. These insights reveal where neighborhoods are cooling, where biodiversity is thinning, and where the green balance is shifting.

Beyond urban greenery, our analytics extend to wider environmental issues such as CO₂ emissions, and biodiversity loss areas where satellite and open datasets provide timely, science-driven visibility.

Key Features

  • Real-time NDVI (Normalized Difference Vegetation Index) monitoring
  • Historical trend analysis and visualization

Our Methods Note

All datasets are processed on cloud infrastructure (AWS) and fetched via the Microsoft Planetary Computer for Sentinel-2 access. While grounded in scientific principles, outputs are presented in accessible formats so that technical imagery and calculations resonate with ordinary people and communities.

Because only when it is relatable, can it tell clear stories about our greenery and urban life: shaping how we live, how we breathe, and how we cope with rising heat.

Satellite Systems

  • Sentinel-2: 10 m resolution for optical and vegetation analysis (NDVI, NDWI) and 20 m for urban indices such as NDBI.
  • Landsat 8 / 9: 30 m resolution multispectral imagery ideal for long-term environmental trend analysis.
  • MODIS: Daily global imagery at moderate resolution for large-scale environmental and climate monitoring.

Data Update Frequency

Our datasets are updated every 5-10 days, depending on satellite revisit times and cloud coverage conditions.

Getting Started

Whether you're a researcher, student or environmental professional, Hug Analytics provides the tools you need to understand green cover dynamics in your area of interest.

Step 1: Select tab

Choose your area of interest from our global regions

Step 2: Analyze Data

Explore NDVI and NDBI trends, seasonal patterns, and change detection

Step 3: Generate Insights

Create reports, download data and images for free

Satellite NDVI and NDBI Analytics for Urban Forestry and Regional Green Cover

Fresh insights on urban canopy and greenness are published regularly: monthly, half-yearly, and for selected special reports using Sentinel-2 NDVI and NDBI analysis. These updates track how cities and regions around the world are changing in terms of vegetation, tree cover, and ecological balance. Each post highlights satellite-derived greenness indicators with clear, easy-to-read visuals and ongoing comparisons over time, making complex data simple and relatable for everyone.

🌏 Australia & Oceania

Sydney urban landscape

Urban Green Cover and Built-up Analysis – Sydney Region, Australia Quarterly

Sentinel-2 NDVI and NDBI analysis showing greenness distribution, urban green cover trends and built up analysis for Sydney city and suburbs.

View Archive Page - for older posts
Melbourne urban landscape

Urban Green Cover and Built-up Analysis – Melbourne Region, Australia Half-Yearly

Sentinel-2 NDVI and NDBI analysis showing greenness distribution, urban green cover trends and built up analysis for Melbourne city and suburbs.

View Archive Page - for older posts

🌏 Asia

Singapore urban landscape

Urban Green Cover and Built-up Analysis – Singapore Region Monthly

Sentinel-2 NDVI and NDBI analysis showing greenness distribution and urban green cover trends for Singapore city and suburbs.

View Archive Page - for older posts
Chennai urban landscape

Urban Green Cover and Built-up Analysis – Chennai Region Monthly

Sentinel-2 NDVI and NDBI analysis showing greenness distribution and urban green cover trends for Chennai city and suburbs.

View Archive Page - for older posts

Global CO₂ & Biodiversity Analytics (Open Datasets)

Explore comprehensive analyses of global CO₂ emissions, biodiversity trends, and land use patterns using open datasets. These reports provide data-driven insights into climate change impacts, species conservation challenges, and ecological transformations happening across our planet.

CO2 emissions visualization

Global CO₂ Emissions: Trends, Impacts, and Data-Driven Insights

Global CO₂ emissions

Biodiversity and land use mapping

Mapping Our Planet: Biodiversity and Land Use

Mapping our planet's biodiversity and land use

Threatened species analysis

Where Biodiversity Is Vanishing: Top 25 Countries With the Most Threatened Species

Explore global biodiversity loss with interactive maps of the 25 countries that host the most threatened species.