Urban Green Cover & Built-up Analysis — Chennai-region
Monthly Analysis of City Vegetation for Chennai-region, tracking vegetation health and urban development trends from satellite data. This digest integrates NDVI and NDBI indices, highlights zones of vegetation stress versus built-up surfaces, and assesses urban heat island effect with heat-risk mapping and 3D visualizations.
Published on: 2025-09-28
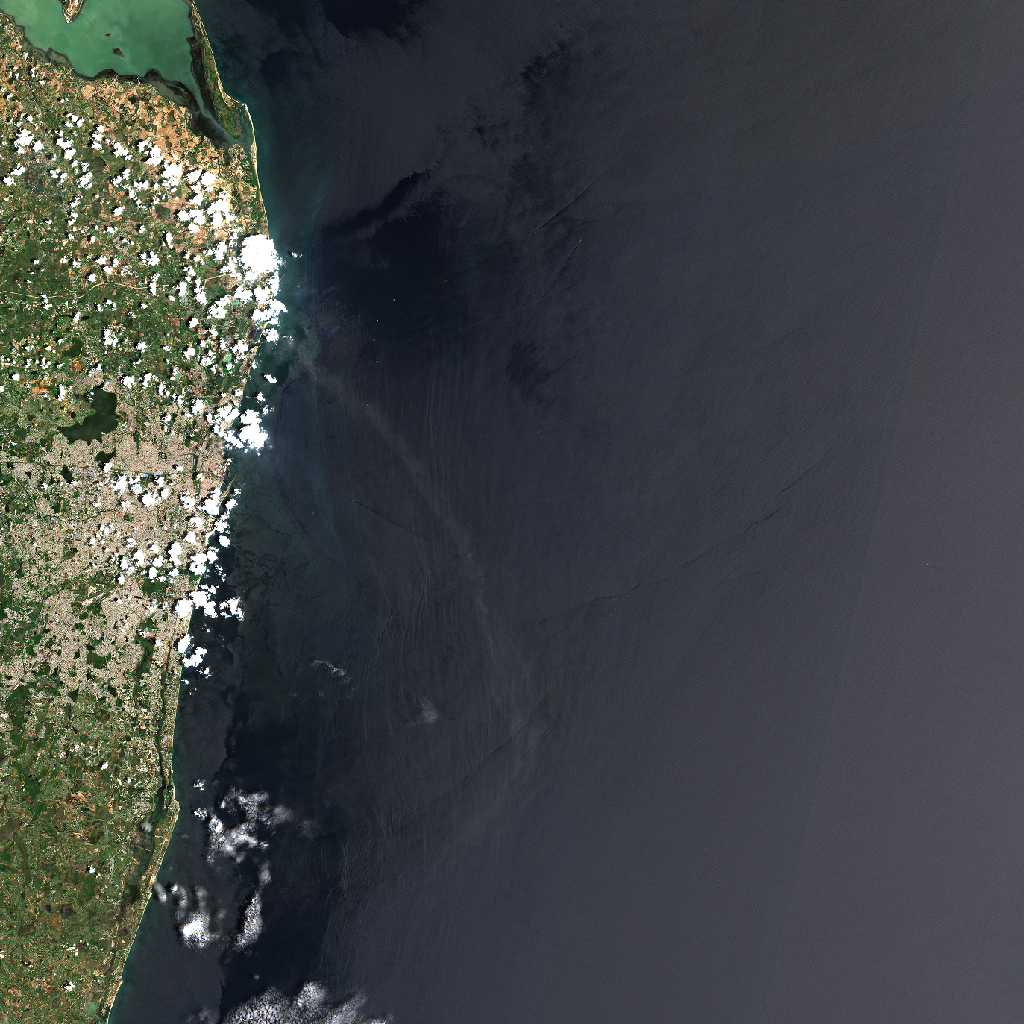
This preview, captured by the Sentinel-2 satellite from its orbit at approximately 786 km above Earth, shows the Chennai region in striking detail. The city lies at the center of the frame, stretching southward along the coast to Mahabalipuram, while in the north the dark green wetlands and inland waters of Pulicat stand out vividly. The contrasting shades highlight both the dense urban core and the surrounding natural landscapes. Imagery observed on 2025-09-08 .
NDVI
NDVI — color visualization
NDVI — greyscale (index values)
NDVI csv values
No CSV data available.
NDBI (Built-up Index)
NDBI — color visualization
NDBI — greyscale (index values)
NDBI csv values
No CSV data available.
NDVI − NDBI & Heat Risk
Difference visualization — highlights vegetation vs built-up dominance.
Heat risk interpretation derived from NDVI–NDBI difference.
- Areas with NDVI values above 0.500 are likely lush, green zones that contribute to cooling.
- Regions where NDBI exceeds 0.300 may experience increased urban heat due to dense construction.
- Transitional zones with mixed NDVI and NDBI values could benefit from targeted greening efforts.
3D Renders (Rayshader & Rayrender)
Rayshader 3D visualization derived from NDVI height-extrusion
Rayrender 3D visualization derived from NDVI height-extrusion
Interactive NDVI overlay (zoom, pan, transparency). Use it alongside the static maps above.
Urban heat island effect
Our analysis indicates that built-up surfaces predominate in the Chennai region, with a mean difference of 0.175 between NDBI and NDVI. This suggests increased urban heat risk in areas where construction is dense. We recommend a monthly monitoring cadence to observe changes, prioritize greening efforts in transitional zones, and engage the community in urban cooling initiatives.Disclaimer: this analysis refers to the satellite crop / geo-bounds stored under the 'Chennai-region' folder (may include extended suburbs) and does not represent the full administrative limits of Chennai.
References & Data
Free to Download (Please cite):
I Hug Trees NDVI Data Citation:
The NDVI and NDBI GeoTIFF and images are provided by I Hug Trees for scientific purposes. Please cite as:
    @misc{ihugtrees_ndvi_2025,
      author    = {I Hug Trees},
      title     = {NDVI and NDBI Analysis Data - Chennai region 2025},
      year      = 2025,
      note      = {GeoTIFF and images provided for scientific purposes},
      url       = {https://ihugtrees.org}
    }
Microsoft Planetary Computer Citation
If the Planetary Computer is useful for your work, please cite it using this record on Zenodo:
    @software{microsoft_open_source_2022_7261897,
      author       = {Microsoft Open Source and
                      Matt McFarland and
                      Rob Emanuele and
                      Dan Morris and
                      Tom Augspurger},
      title        = {microsoft/PlanetaryComputer: October 2022},
      month        = oct,
      year         = 2022,
      publisher    = {Zenodo},
      version      = {2022.10.28},
      doi          = {10.5281/zenodo.7261897},
      url          = {https://doi.org/10.5281/zenodo.7261897}
    }