Urban Green Cover & Built-up Analysis — Chennai-region
Monthly Analysis of City Vegetation for Chennai-region, tracking vegetation health and urban development trends from satellite data. This digest integrates NDVI and NDBI indices, highlights zones of vegetation stress versus built-up surfaces, and assesses urban heat island effect with heat-risk mapping and 3D visualizations.
Published on: 2025-09-29
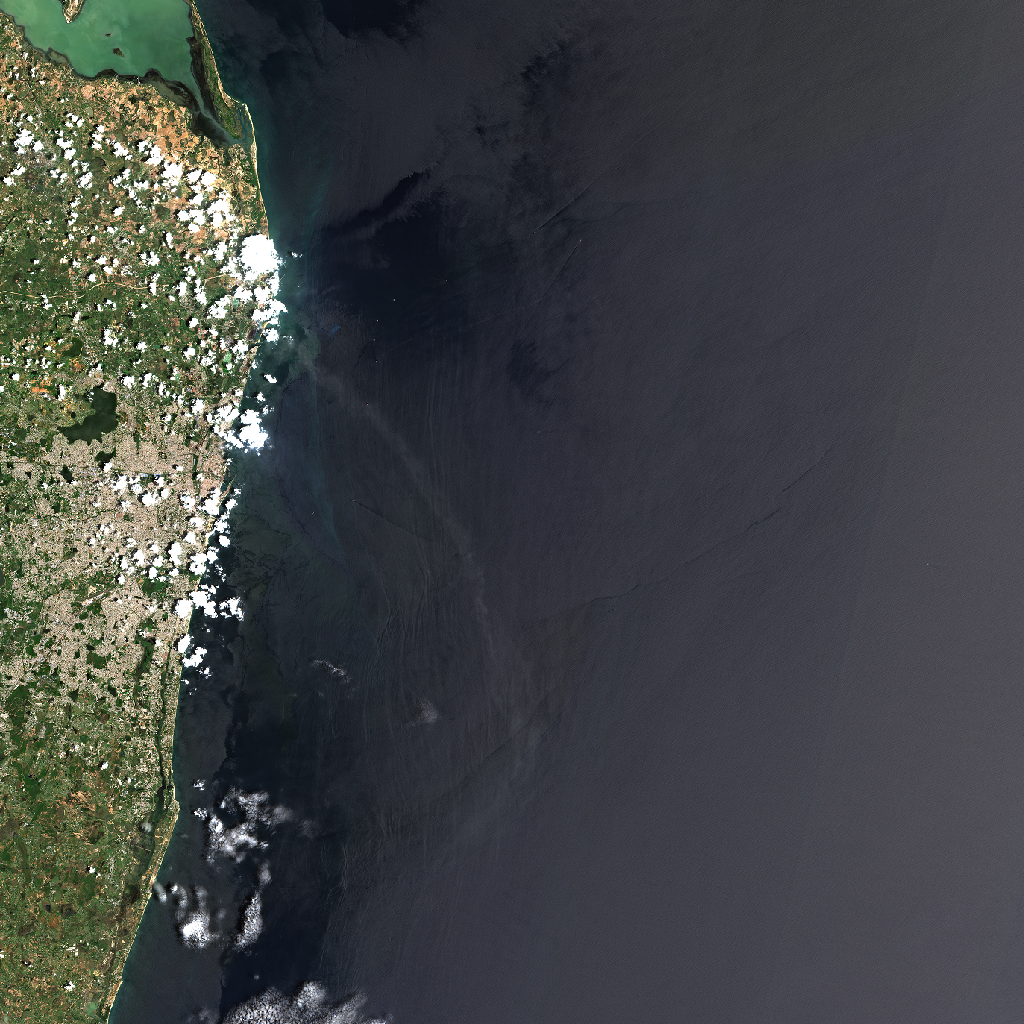
This preview, captured by the Sentinel-2 satellite from its orbit at approximately 786 km above Earth, shows the Chennai region in striking detail. The city lies at the center of the frame, stretching southward along the coast to Mahabalipuram, while in the north the dark green wetlands and inland waters of Pulicat stand out vividly. The contrasting shades highlight both the dense urban core and the surrounding natural landscapes. Imagery observed on 2025-09-08 .
Welcome to the latest environmental digest for the Chennai region, powered by Sentinel-2 satellite data from September 8, 2025. This month's analysis leverages the Normalized Difference Vegetation Index (NDVI) to gauge vegetation health and the Normalized Difference Built-up Index (NDBI) to assess built-up intensity. Only images with cloud cover below 50% are considered, ensuring reliable data. This monthly digest, curated by I Hug Trees and sourced from the Microsoft Planetary Computer, highlights a significant contrast between vegetation and built-up areas in the region.
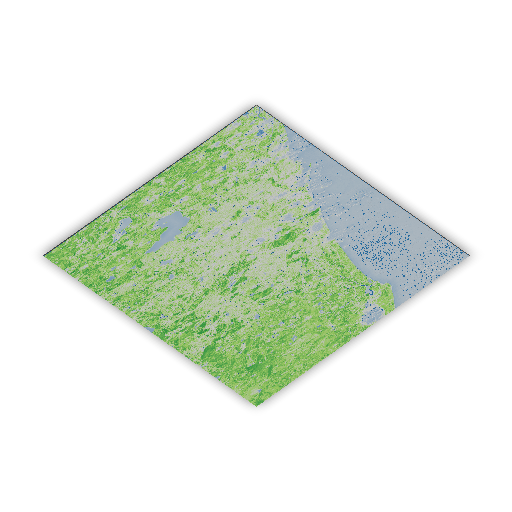
NDVI
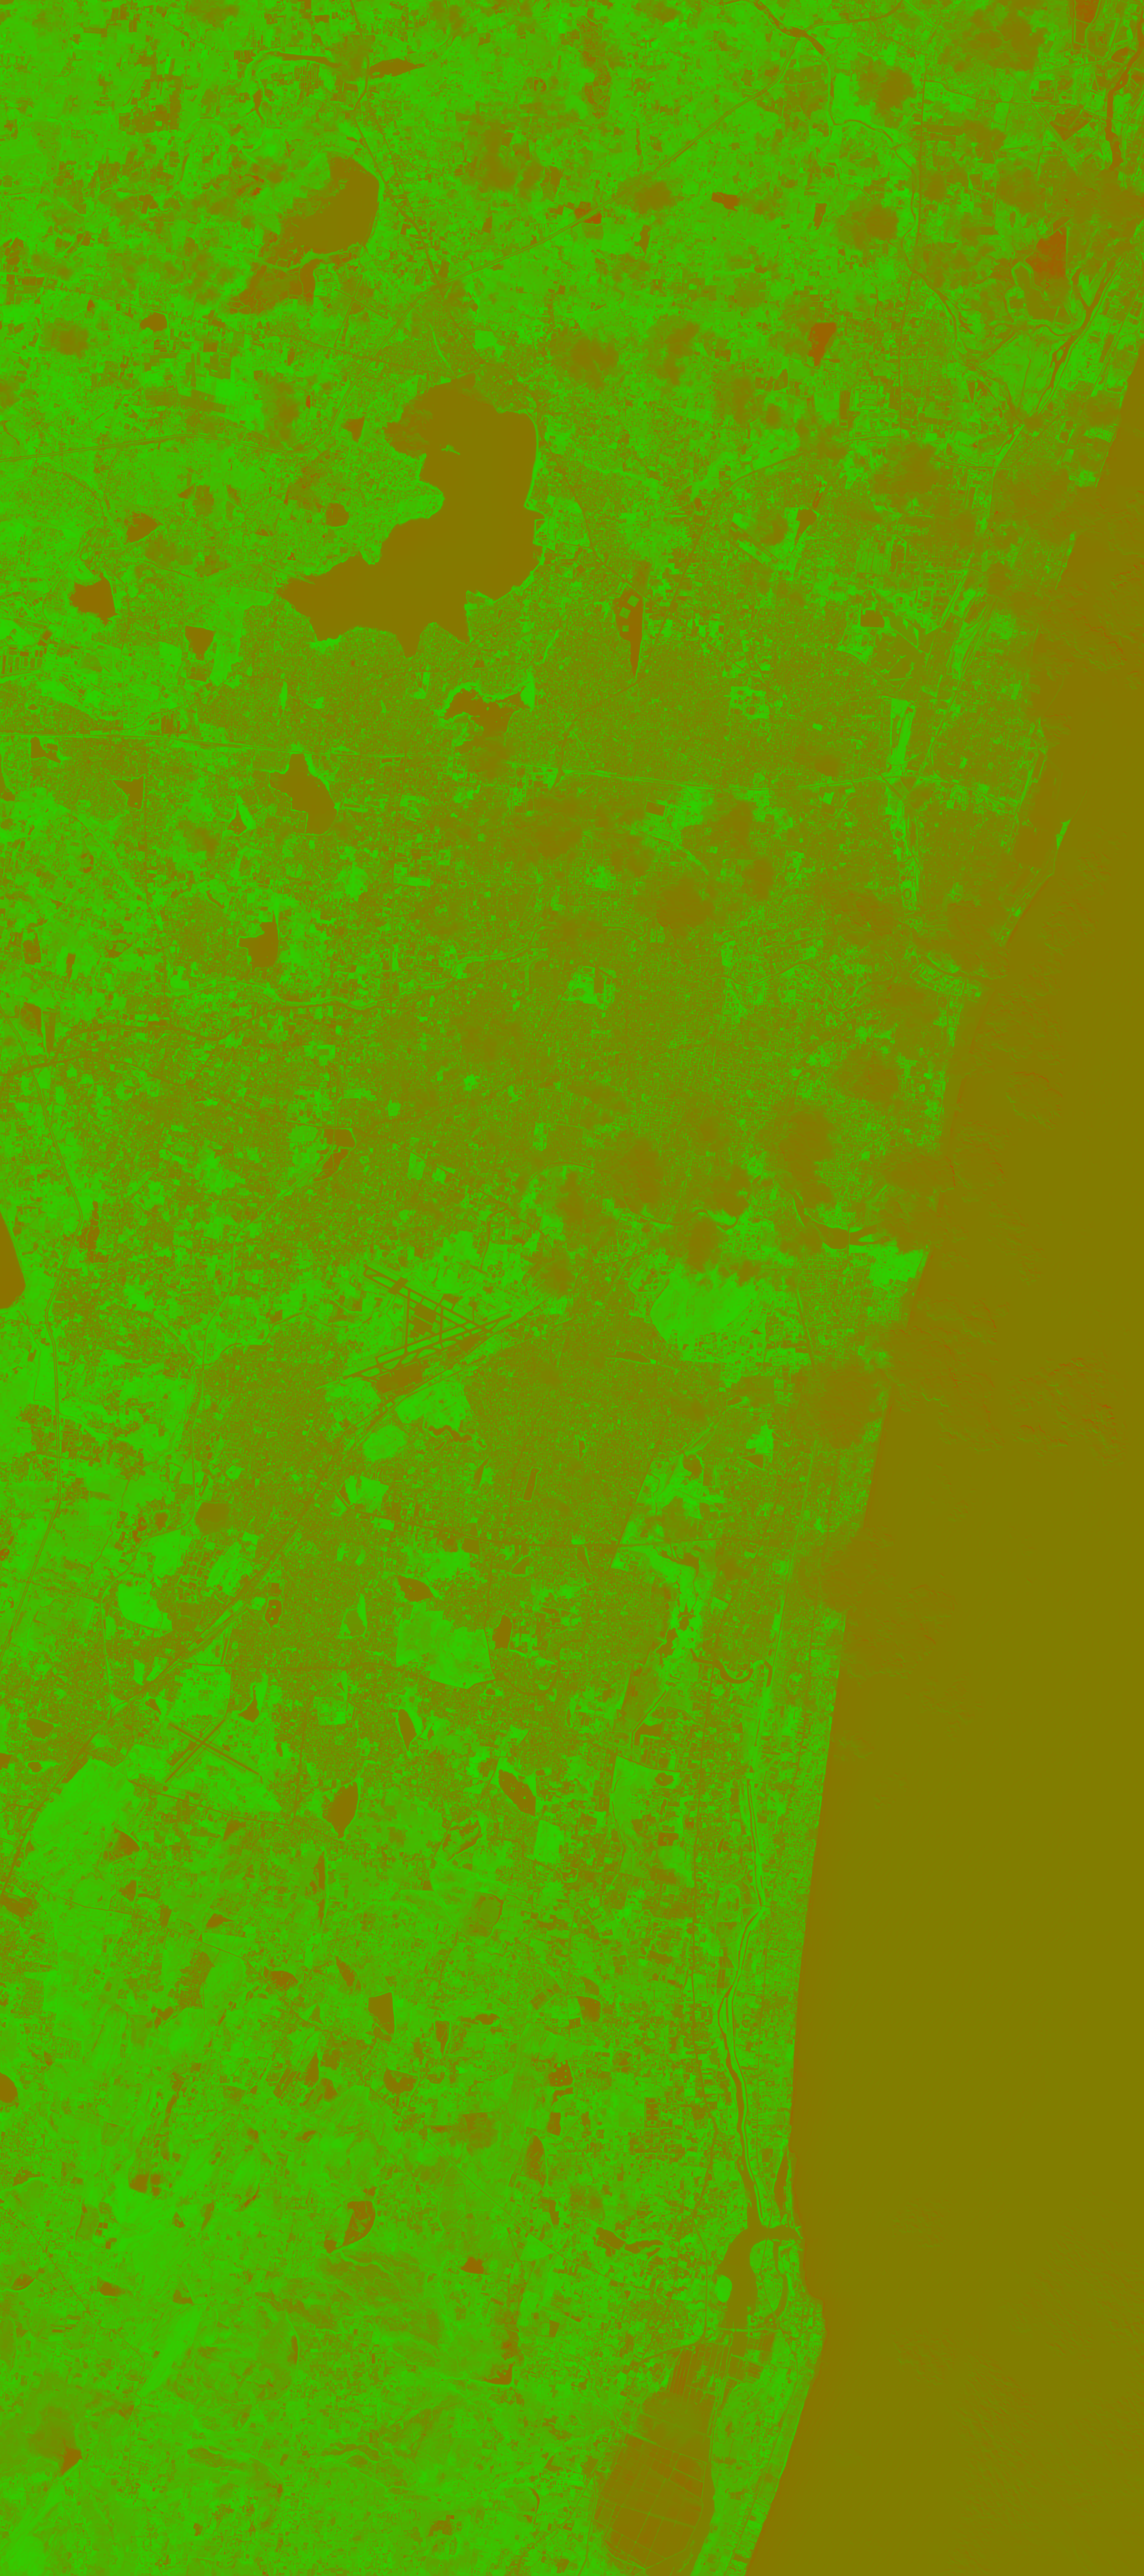
NDVI — color visualization
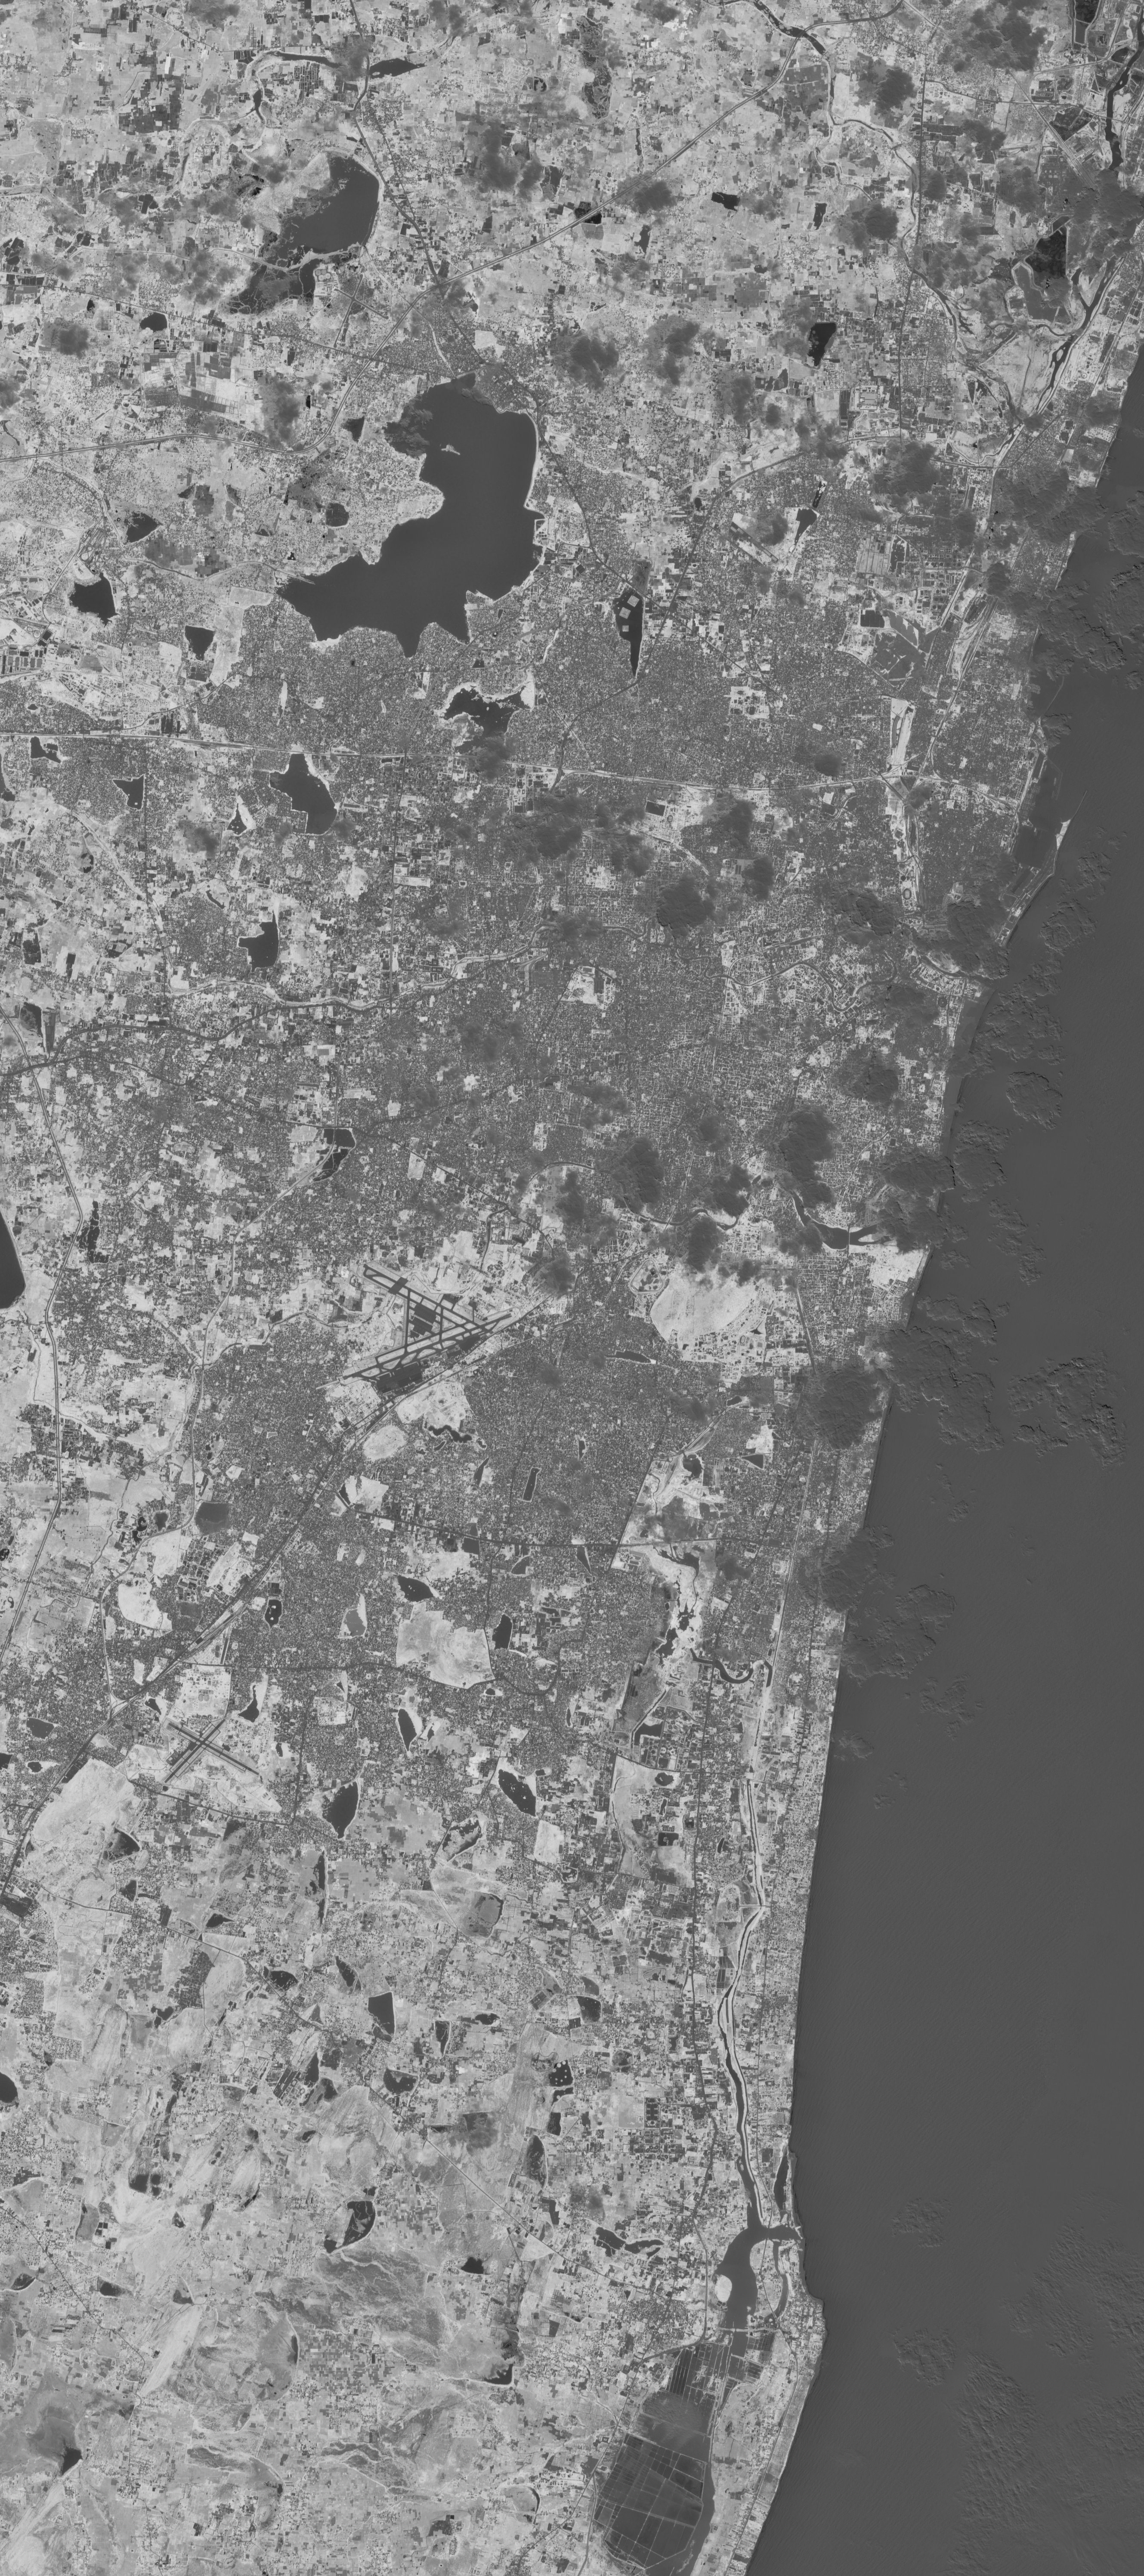
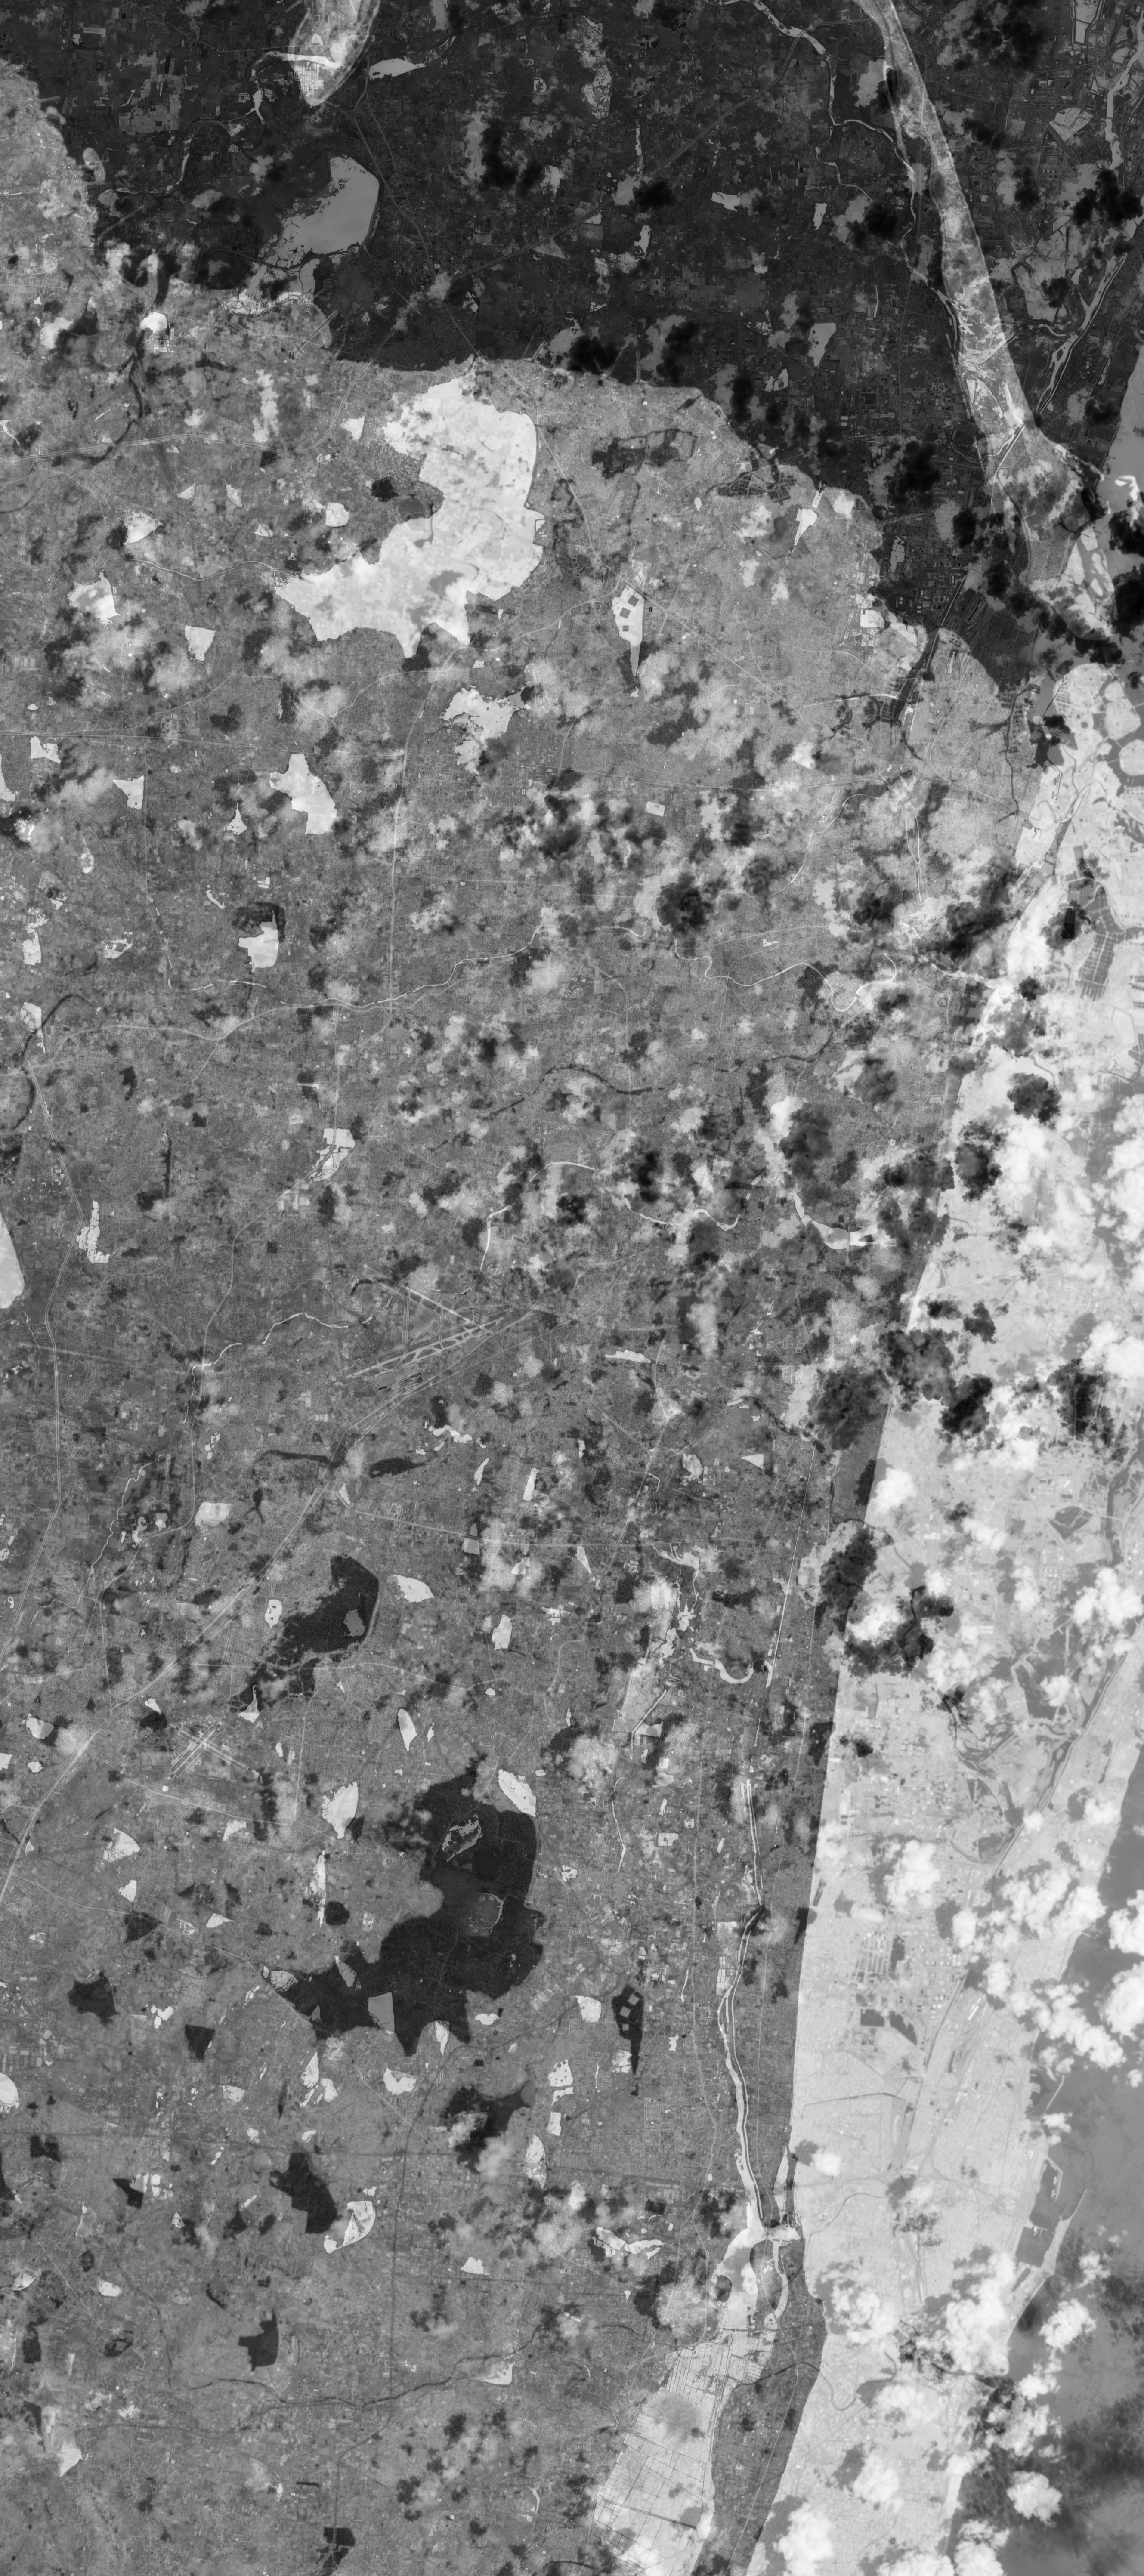
NDVI — greyscale (index values)
NDVI csv values
| min | max | mean | median | stddev |
|---|---|---|---|---|
| -0.4485921859741211 | 0.8750731348991394 | 0.21547739207744598 | 0.186454176902771 | 0.20326893031597137 |
NDBI (Built-up Index)
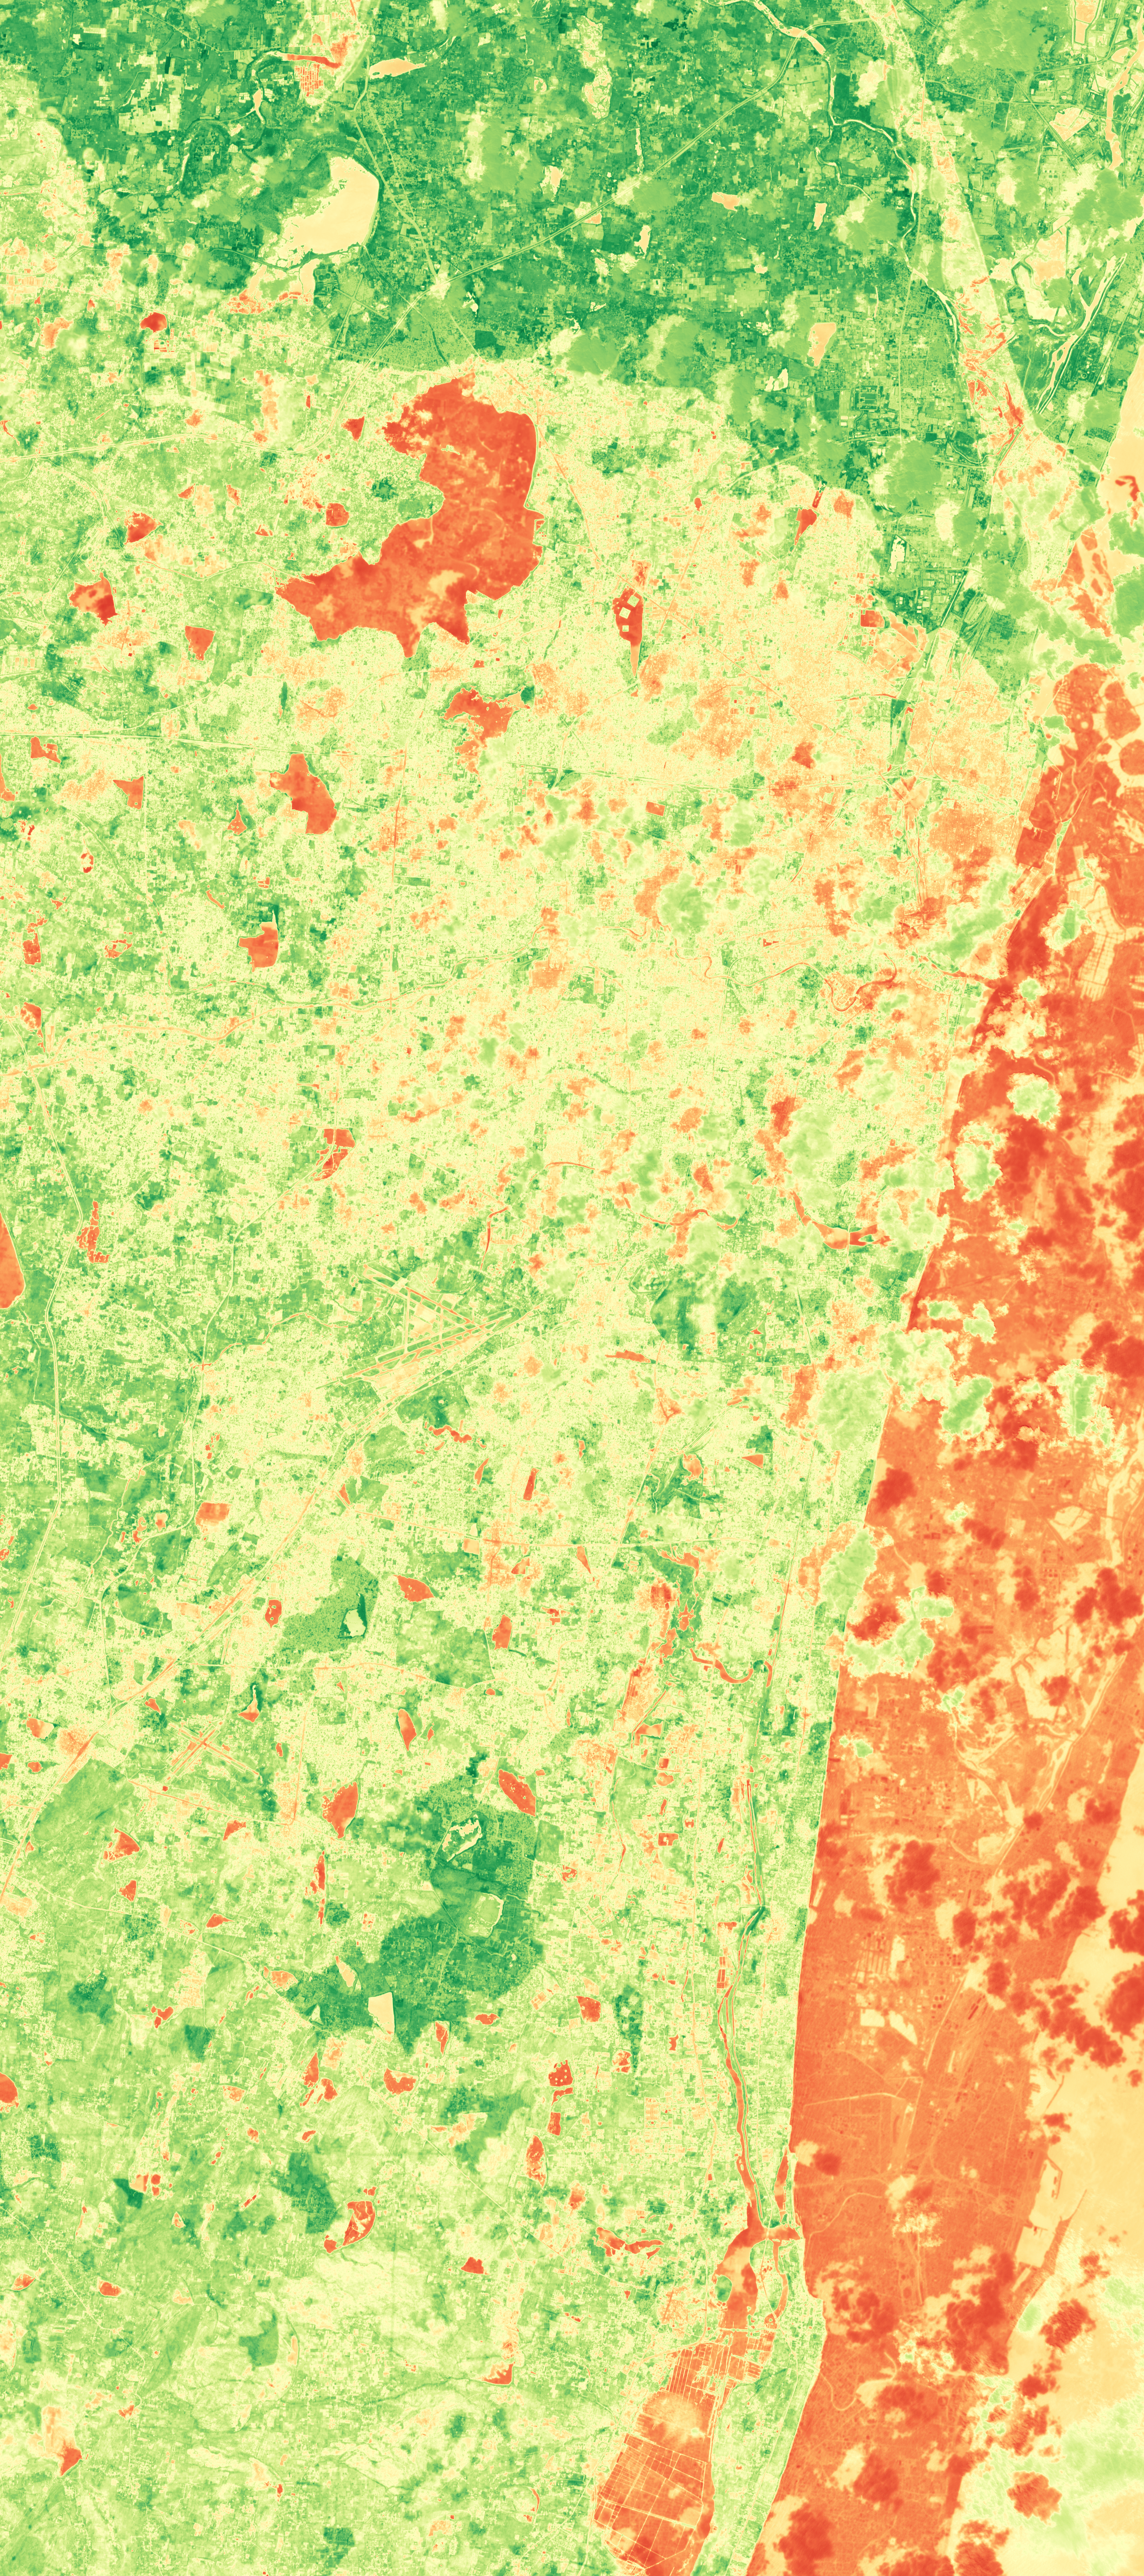
NDBI — color visualization
NDBI — greyscale (index values)
NDBI csv values
| min | max | mean | median | stddev |
|---|---|---|---|---|
| -0.8564348220825195 | 0.845417320728302 | -0.03905818983912468 | -0.0476665124297142 | 0.3333911895751953 |
NDVI − NDBI & Heat Risk
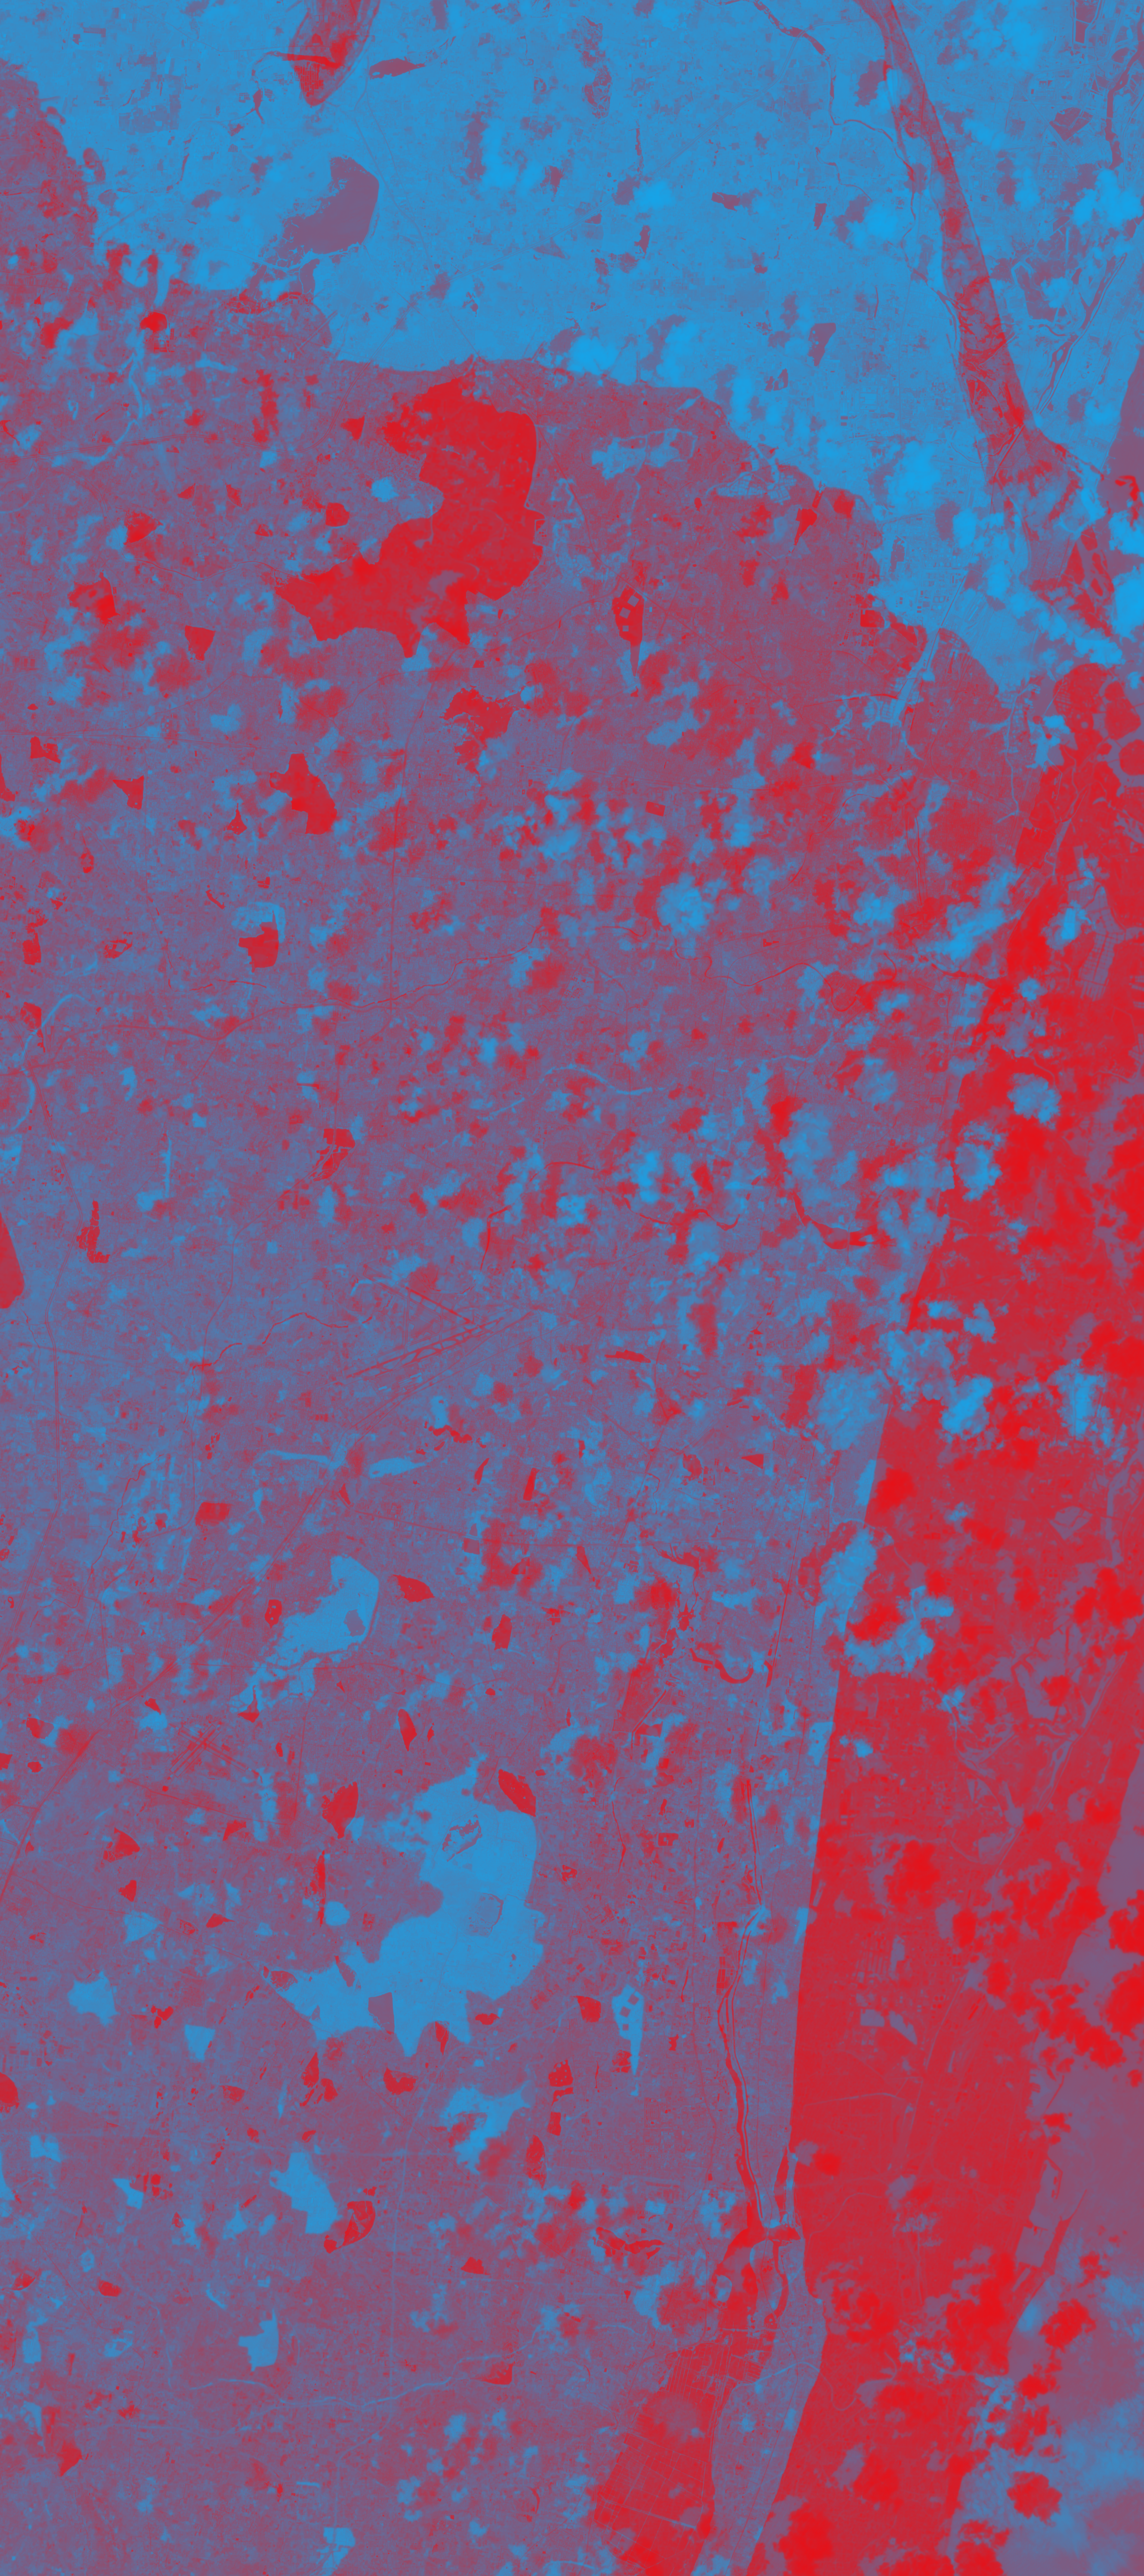
Difference visualization — highlights vegetation vs built-up dominance.
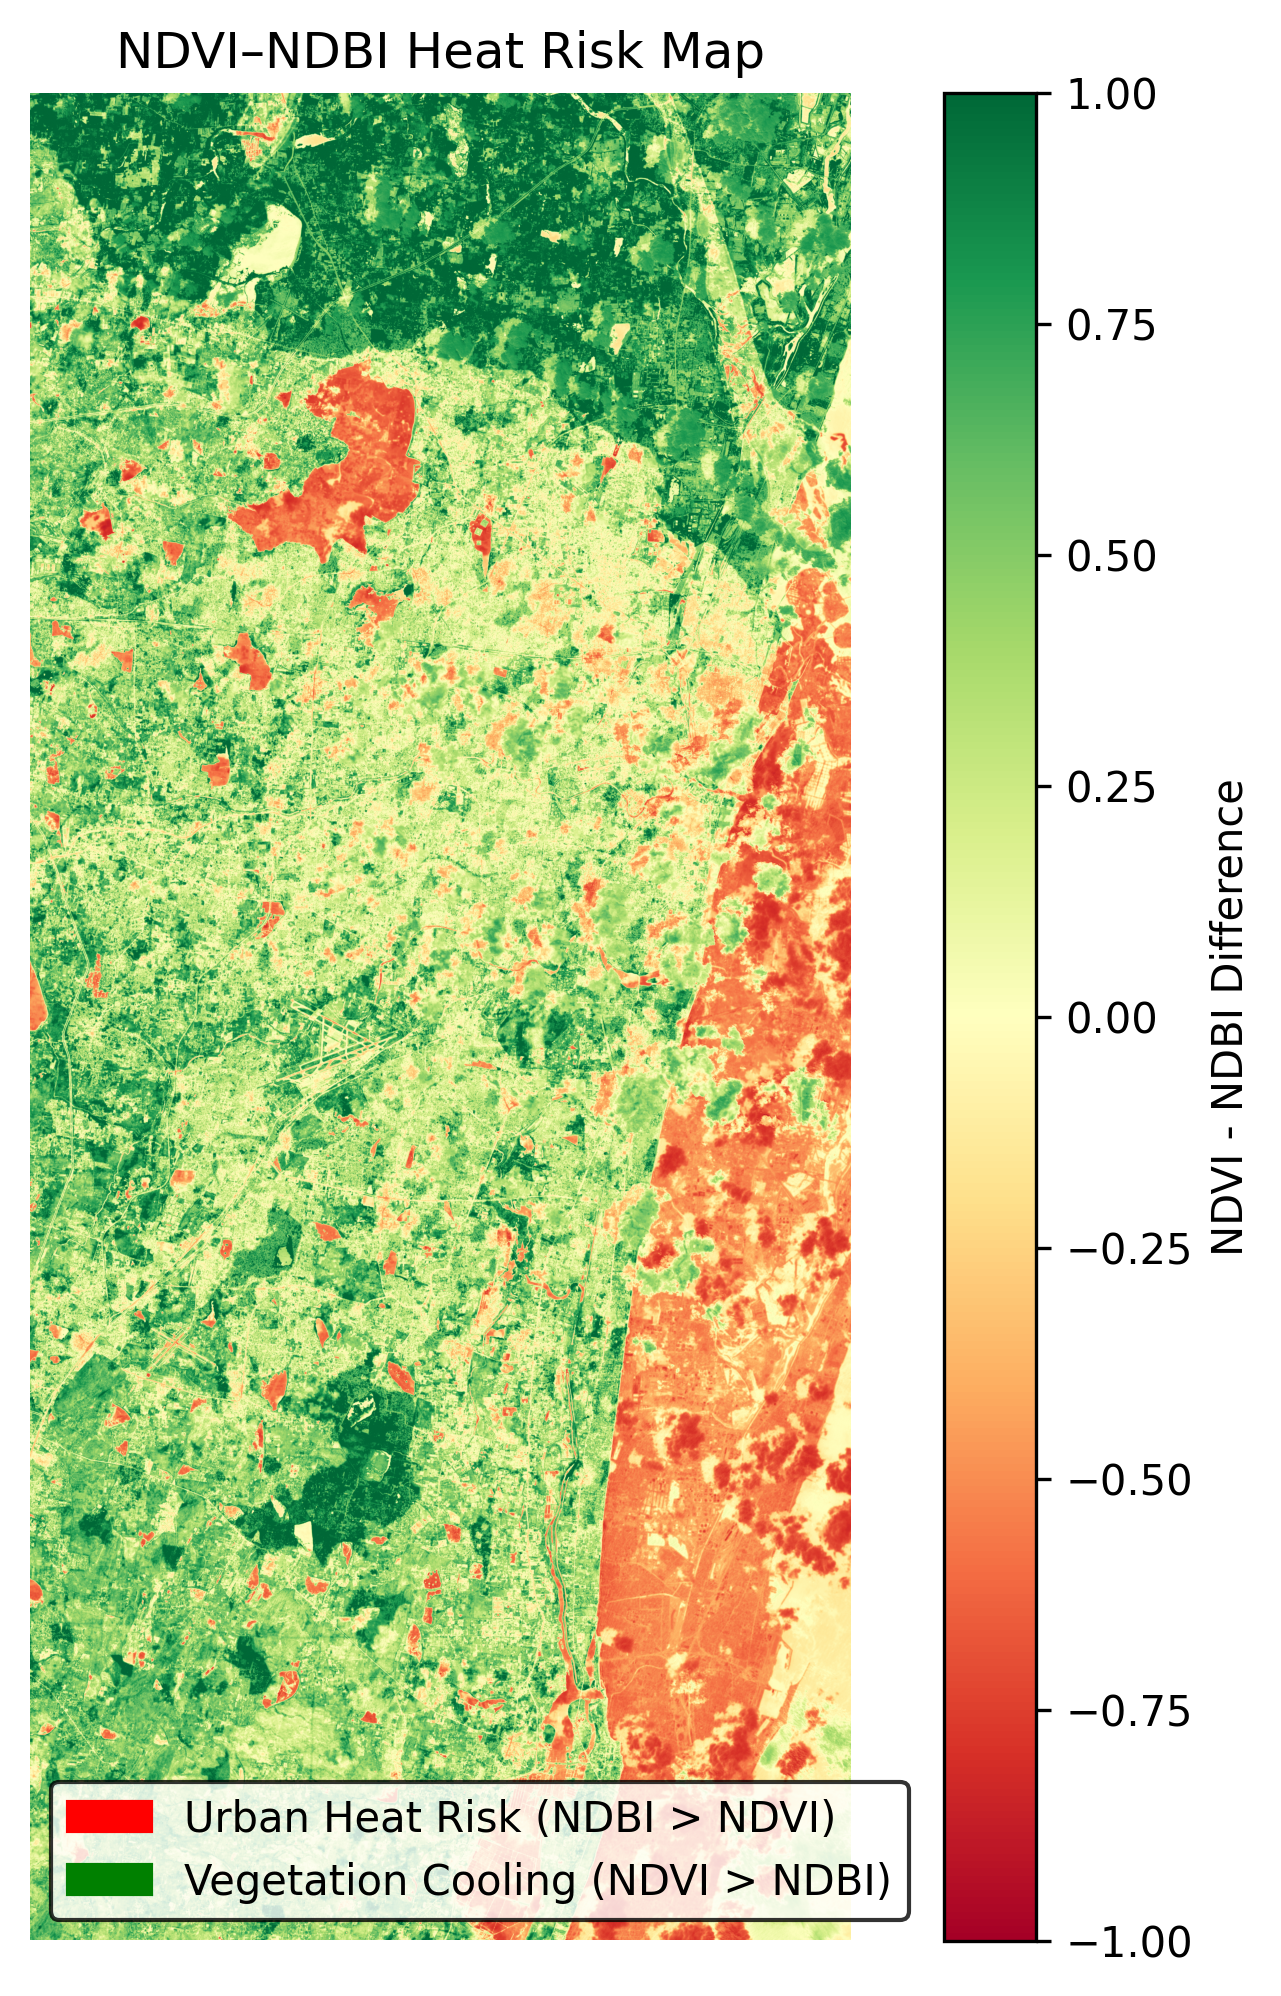
Heat risk interpretation derived from NDVI–NDBI difference.
The NDVI readings for the Chennai region reveal a wide range of vegetation health, with a minimum value of -0.449 indicating sparse or stressed vegetation, a maximum of 0.875 suggesting lush, healthy vegetation, a mean of 0.215 pointing to moderate tree/vegetation cover, a median of 0.186 reflecting the central tendency of vegetation density, and a standard deviation of 0.203 showing variability in vegetation across the region.
In contrast, the NDBI values show a predominance of vegetation over built-up surfaces, with a minimum of -0.856, a maximum of 0.845, a mean of -0.039, a median of -0.048, and a standard deviation of 0.333. The negative mean and median NDBI values indicate that vegetation is more extensive than built-up areas, though the positive maximum value highlights localized built-up hotspots.
Comparing NDVI and NDBI, the mean difference (NDBI - NDVI) is -0.254, indicating that vegetation predominates over built-up surfaces in the Chennai region. This suggests a cooling effect where NDVI values exceed NDBI values (see ndvi_ndbi_diff_color.png).
The NDVI–NDBI difference map identifies areas where vegetation likely provides cooling benefits and where built-up surfaces may increase urban heat risk. Areas where NDBI exceeds NDVI are flagged as higher heat-risk zones, while areas where NDVI surpasses NDBI are likely cooling or vegetated (see ndvi_ndbi_heatrisk.png).
- Focus on preserving and expanding green spaces in high NDVI areas.
- Monitor and mitigate heat risks in built-up hotspots identified by high NDBI values.
- Consider the integration of green infrastructure in urban planning to enhance cooling effects.
3D Renders (Rayshader & Rayrender)
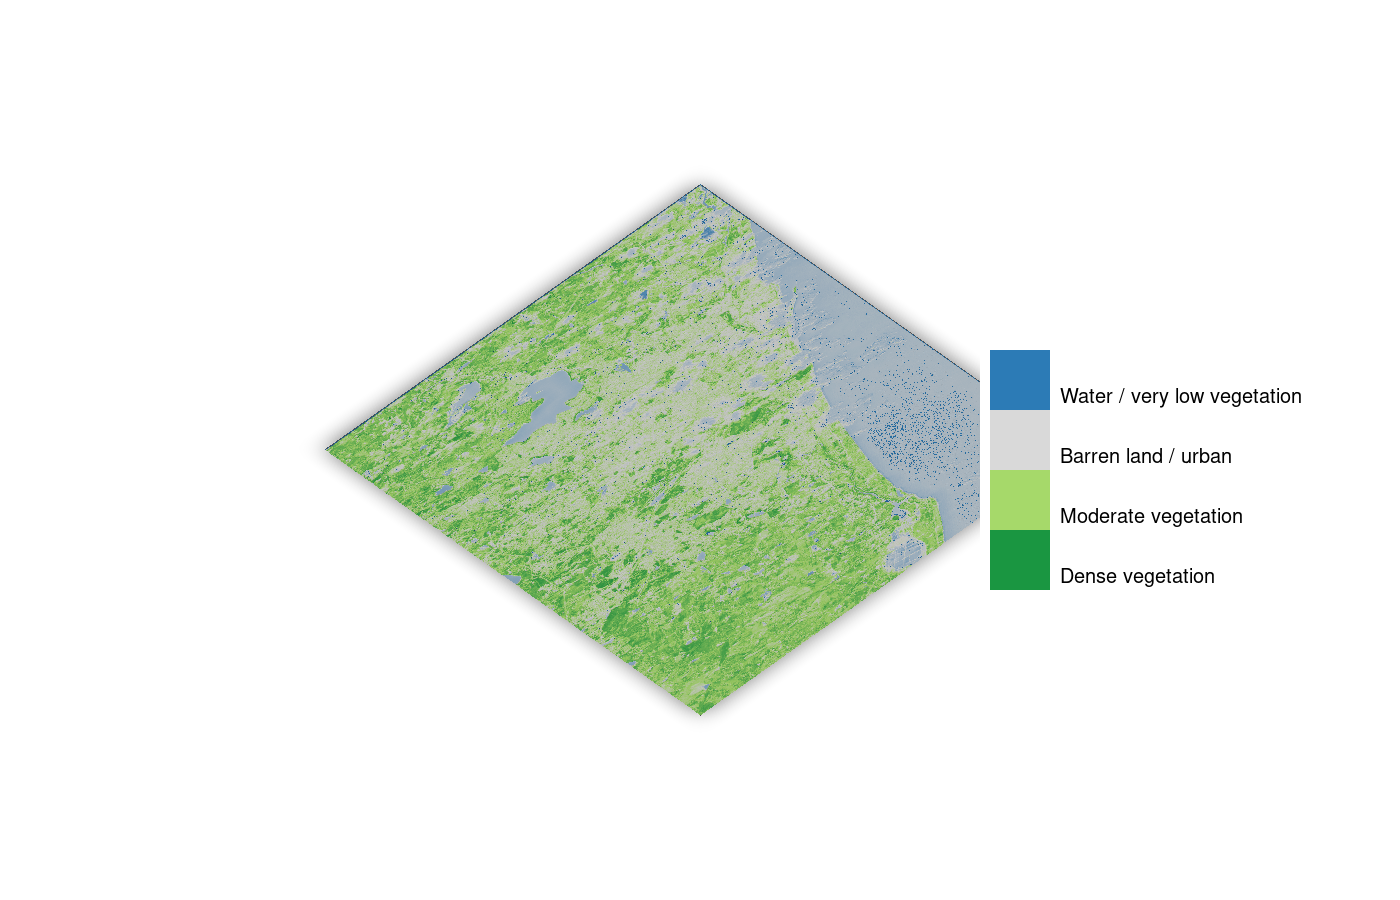
Rayshader 3D visualization derived from NDVI height-extrusion
Rayrender 3D visualization derived from NDVI height-extrusion
Interactive NDVI overlay (zoom, pan, transparency). Use it alongside the static maps above.
To explore the data further, use the interactive overlay (ndvi_map.html) to zoom in on specific areas, adjust the transparency slider for layer comparison, and validate features against high-resolution basemaps. Note that the analysis is limited by the cloud cover percentage from the metadata, which was 2.41% for this observation. Immediate next steps include field validation of satellite observations and establishing a repeat monitoring cadence to track changes over time.
Urban heat island effect
In summary, the Chennai region exhibits a predominance of vegetation over built-up surfaces, with a mean difference of -0.254 indicating significant cooling effects from green areas. To maintain and enhance these benefits, it is recommended to monitor vegetation health regularly, prioritize the restoration of degraded areas, and engage the community in urban greening initiatives. Disclaimer: this analysis refers to the satellite crop / geo-bounds stored under the 'Chennai-region' folder (may include extended suburbs) and does not represent the full administrative limits of Chennai.
References & Data
Free to Download (Please cite):
I Hug Trees NDVI Data Citation:
The NDVI and NDBI GeoTIFF and images are provided by I Hug Trees for scientific purposes. Please cite as:
    @misc{ihugtrees_ndvi_2025,
      author    = {I Hug Trees},
      title     = {NDVI and NDBI Analysis Data - Chennai region 2025},
      year      = 2025,
      note      = {GeoTIFF and images provided for scientific purposes},
      url       = {https://ihugtrees.org}
    }
Microsoft Planetary Computer Citation
If the Planetary Computer is useful for your work, please cite it using this record on Zenodo:
    @software{microsoft_open_source_2022_7261897,
      author       = {Microsoft Open Source and
                      Matt McFarland and
                      Rob Emanuele and
                      Dan Morris and
                      Tom Augspurger},
      title        = {microsoft/PlanetaryComputer: October 2022},
      month        = oct,
      year         = 2022,
      publisher    = {Zenodo},
      version      = {2022.10.28},
      doi          = {10.5281/zenodo.7261897},
      url          = {https://doi.org/10.5281/zenodo.7261897}
    }