Urban Green Cover & Built-up Analysis — Melbourne-region
Half yearly Analysis of City Vegetation for Melbourne-region, tracking vegetation health and urban development trends from satellite data. This digest integrates NDVI and NDBI indices, highlights zones of vegetation stress versus built-up surfaces, and assesses urban heat island effect with heat-risk mapping and 3D visualizations.
Published on: 2025-09-29
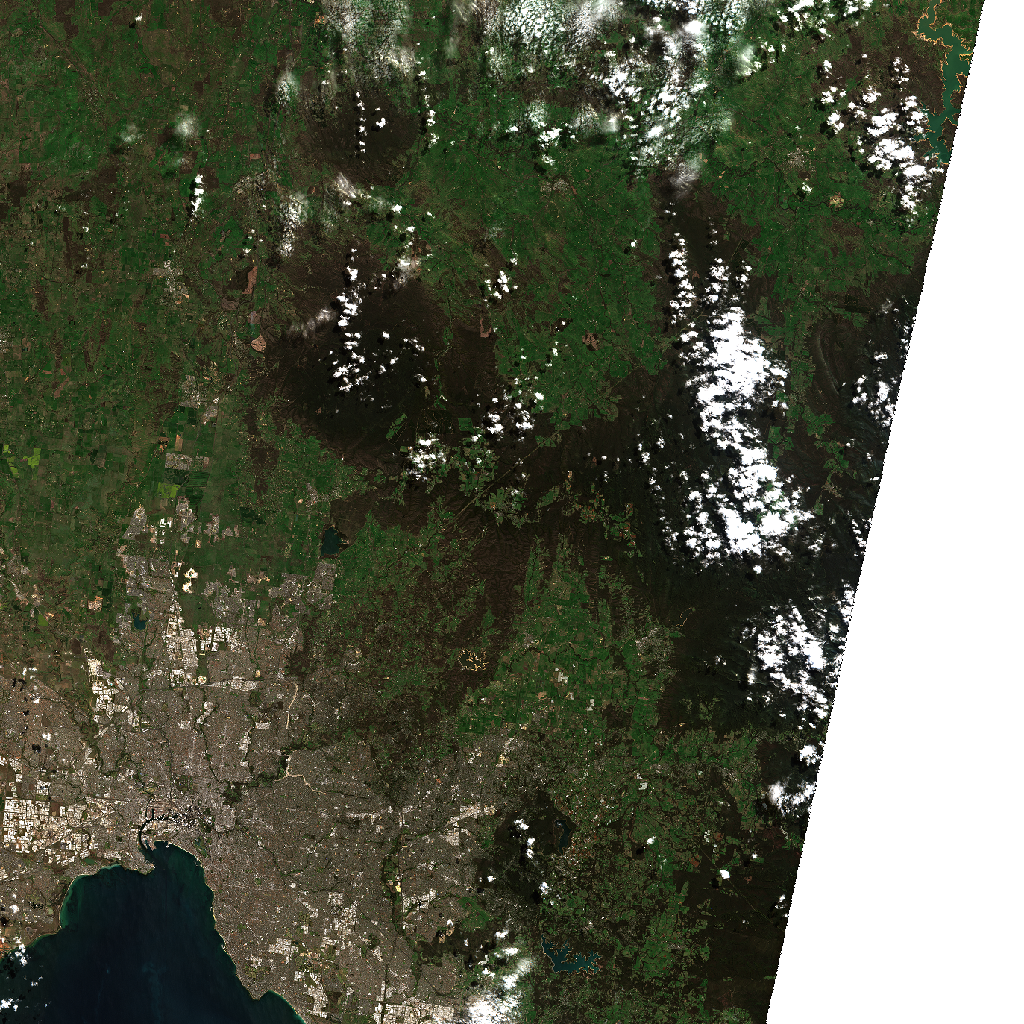
This preview, captured by the Sentinel-2 satellite from its orbit at approximately 786 km above Earth, shows the Melbourne region in striking detail. Urban greenness and built-up patterns across Melbourne, from Newport in the west to East Melbourne and the Bayside in the east, spanning the southern suburbs up to the northern CBD. Imagery observed on 2025-09-18 .
NDVI
NDVI — color visualization
NDVI — greyscale (index values)
NDVI csv values
No CSV data available.
NDBI (Built-up Index)
NDBI — color visualization
NDBI — greyscale (index values)
NDBI csv values
No CSV data available.
NDVI − NDBI & Heat Risk
Difference visualization — highlights vegetation vs built-up dominance.
Heat risk interpretation derived from NDVI–NDBI difference.
- Areas with NDVI > 0.600 are likely dense vegetation corridors.
- Regions where NDBI > 0.500 indicate intense urban development.
- Zones with NDBI > NDVI are at higher risk of urban heat island effects.
3D Renders (Rayshader & Rayrender)
Rayshader 3D visualization derived from NDVI height-extrusion
Rayrender 3D visualization derived from NDVI height-extrusion
Interactive NDVI overlay (zoom, pan, transparency). Use it alongside the static maps above.
Urban heat island effect
The analysis indicates that built-up surfaces predominate in the Melbourne region, with a mean difference of 0.129 between NDBI and NDVI. This suggests increased urban heat risk in areas where NDBI exceeds NDVI. Regular monitoring, coupled with field checks, is essential to validate these findings and inform urban planning decisions. Prioritize restoration efforts in vegetated corridors and implement cooling strategies in high-risk urban areas. Disclaimer: this analysis refers to the satellite crop / geo-bounds stored under the 'Melbourne-region' folder (may include extended suburbs) and does not represent the full administrative limits of Melbourne.References & Data
Free to Download (Please cite):
I Hug Trees NDVI Data Citation:
The NDVI and NDBI GeoTIFF and images are provided by I Hug Trees for scientific purposes. Please cite as:
    @misc{ihugtrees_ndvi_2025,
      author    = {I Hug Trees},
      title     = {NDVI and NDBI Analysis Data - Chennai region 2025},
      year      = 2025,
      note      = {GeoTIFF and images provided for scientific purposes},
      url       = {https://ihugtrees.org}
    }
Microsoft Planetary Computer Citation
If the Planetary Computer is useful for your work, please cite it using this record on Zenodo:
    @software{microsoft_open_source_2022_7261897,
      author       = {Microsoft Open Source and
                      Matt McFarland and
                      Rob Emanuele and
                      Dan Morris and
                      Tom Augspurger},
      title        = {microsoft/PlanetaryComputer: October 2022},
      month        = oct,
      year         = 2022,
      publisher    = {Zenodo},
      version      = {2022.10.28},
      doi          = {10.5281/zenodo.7261897},
      url          = {https://doi.org/10.5281/zenodo.7261897}
    }