Is This Mangrove Forest Actually Healthy? Sundarbans, India
Canopy Stress and Inundation Frequency, Baseline Edition
Introduction
The Sundarbans is the largest mangrove forest in the world, spanning the delta where the Ganges, Brahmaputra, and Meghna rivers meet the Bay of Bengal across India and Bangladesh. Millions of people depend on it directly, for fishing, honey, timber, and protection from cyclones and storm surges. The forest also shelters the last wild population of Bengal tigers living in mangroves anywhere on Earth. Like mangrove forests worldwide, the Sundarbans faces real pressure, rising seas, reduced freshwater flow, and human encroachment, but pressure alone does not tell us whether the forest is actually declining. This report uses satellite data to check and monitor on a periodic basis. For more on why mangrove forests matter globally, see our earlier article on mangrove forests, coastal ecosystems, and marine life.
The Questions We Ask and Answer in This Report
Most mangrove trackers answer this one question very well, that is, how much is the current extent of the forest vis a vis how much existed before. Instead, this report asks two different questions. Is this forest actually healthy underneath its canopy, or is it starting to struggle in ways that have not shown up as browning leaves yet? A scientific term used for this is canopy stress. And is the tidal water still reaching it as often as it needs to, a measurement known as inundation frequency?
Both questions are answered in full in this edition, checked carefully before publishing. We may add more questions like these in future editions and answer them.
Summary of Findings
This report presents two independent satellite-based resilience signals for the Sundarbans mangrove forest. Canopy stress uses Sentinel-2 imagery from 10 April 2026 to map chlorophyll-based stress (NDRE) across two tiles, after masking open water. Inundation frequency uses a Sentinel-1 SAR time series, September 2024 to September 2025, to map how often each part of the AOI was reached by tidal water. Both establish reference states for future comparison. Neither yet indicates whether conditions are improving or declining over time.
Based on chlorophyll content across the canopy, this edition finds no widespread sign of stress. The main tile's canopy is healthy, with a median NDRE of 0.26 and values staying close together. The south tile's canopy is also healthy overall, with a median NDRE of 0.21, though its values vary more. This tile is mostly open sea, with mangroves confined to a narrow strip at the edge, which helps explain the wider spread. Based on a full year of radar observations, tidal water is reaching the forest's transition zone regularly, with the typical location inundated in about two-thirds of monthly observations across the year, and a wide range from occasionally flooded to almost constantly wet reflecting real variation in tidal reach across the delta.
Canopy stress: Chlorophyll content across the mangrove canopy on the Indian side is healthy.
Inundation frequency: Tidal water is reaching the forest's transition zone regularly, consistent with functioning mangrove hydrology.
Glossary
- NDRE (Normalized Difference Red Edge): measures chlorophyll content in leaves, used here to detect canopy stress.
- NDWI (Normalized Difference Water Index): identifies where water is present in a satellite image.
- Canopy stress: an early decline in leaf health that occurs before visible browning or leaf loss.
- SAR (Synthetic Aperture Radar): a satellite imaging method that measures reflected radar pulses rather than sunlight, working through cloud cover and at night.
- Inundation frequency: the share of monthly observations in which a given location was under water.
- Tidal-transition zone: land inundated sometimes but not always, as distinct from permanently dry land or permanently open water.
- Water masking: removing water pixels from a calculation so they do not distort land-based results.
- Baseline edition: a first reference measurement, used later to detect change over time.
- Tile: one fixed satellite image area. Canopy stress is measured across two tiles.
- Percentile (p10, p90): a way to describe typical range while setting aside extreme values. p10 means 90% of pixels score higher than this value; p90 means only the top 10% score higher.
Observation Metadata
| Region | Sundarbans, India (Bhagirathi/Hooghly mangrove belt) |
| Canopy stress platform | Sentinel-2A (Sentinel-2 constellation) |
| Canopy stress observation date | 10 April 2026 |
| Canopy stress cloud cover | 0.7% (main tile), 1.8% (south tile) |
| Canopy stress spectral bands | B04 (Red), B05 (Red Edge), B08 (NIR), B03 (Green) |
| Inundation frequency platform | Sentinel-1A (Sentinel-1 constellation) |
| Inundation frequency observation period | September 2024 to September 2025 |
| Processing date | 22 September 2026 |
The canopy-stress date was used because current-season passes exceeded the 30% cloud-cover threshold set for reliable analysis. 10 April 2026 is the most recent qualifying pass and is used here as a dry-season baseline reference, not as current conditions. Inundation frequency uses one representative scene per month across a full year rather than a single date, since it requires observation across a seasonal cycle.
Primary Data Extraction Source
- Canopy stress raw satellite tiles: Copernicus Data Space Ecosystem (CDSE), Microsoft Planetary Computer (MPC)
- Inundation frequency raw satellite tiles: Microsoft Planetary Computer (MPC), Sentinel-1 RTC collection
- Data Extraction, Processing, Analysis, Synthesis & Reporting: Hug Analytics, I Hug Trees
Area of Interest (AOI)
| Signal | Tile / AOI | Bounding box (lon, lat) | Approx. area |
|---|---|---|---|
| Canopy stress | Main | 87.966°E, 21.603°N to 89.041°E, 22.604°N | 111 km × 111 km |
| Canopy stress | South | 87.960°E, 20.700°N to 89.028°E, 21.701°N | 111 km × 111 km |
| Inundation frequency | Full combined AOI | 87.96°E, 20.70°N to 89.04°E, 22.60°N | ~115 km × ~215 km |
The canopy-stress tiles are analyzed independently, unmosaicked. Inundation frequency uses one continuous AOI covering the full delta, since it is analyzed as a single spatial pattern rather than by tile. This AOI extends from the Hooghly river mouth in the northwest across the Indian Sundarbans to the India-Bangladesh border region in the east, and south into the Bay of Bengal, so that the tidal-transition zone at the coastline is fully captured rather than cut off at an arbitrary edge.
The Resilience Signals
Canopy Stress
IN THIS EDITIONNDRE: chlorophyll decline before visible browning.
Inundation Frequency
IN THIS EDITIONIs tidal water reaching the forest as often as it needs to.
Canopy Stress (NDRE)
NDRE uses the red-edge band to detect chlorophyll decline, a stress signal that shows up weeks before canopy browning is visible to the eye or to standard vegetation indices.
Method note: water masking
Raw NDRE across a tile that includes open sea produces a misleading reading. NDWI was used to identify and mask water pixels before computing canopy-stress statistics. The values below reflect vegetated land only.
Main tile
Left: before water masking. Right: after water masking.
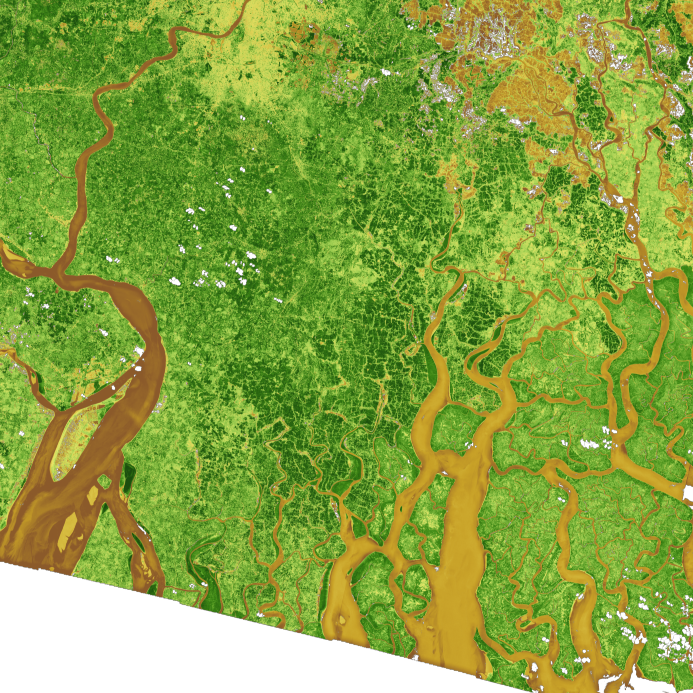
Main forested body of the Indian Sundarbans, north of the river mouth (AOI: 87.966°E to 89.041°E, 21.603°N to 22.604°N). Before masking. Water pixels are included and can read as false low-stress values. Brown to green shows increasing chlorophyll, low to high.
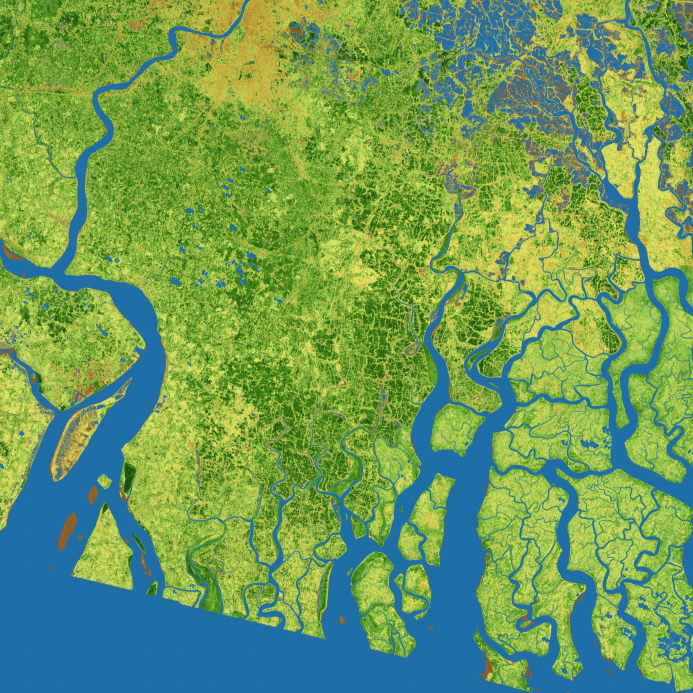
Same area after water masking. Blue = water, excluded from the stress scale. Brown, gold, green = increasing canopy chlorophyll content, low to high.
Reflects the 10 April 2026 dry-season baseline. This is a reference state, not current conditions.
| Mean NDRE | 0.25 |
| Median NDRE | 0.26 |
| Water, share of tile | 20.0% |
South tile
Left: before water masking. Right: after water masking.
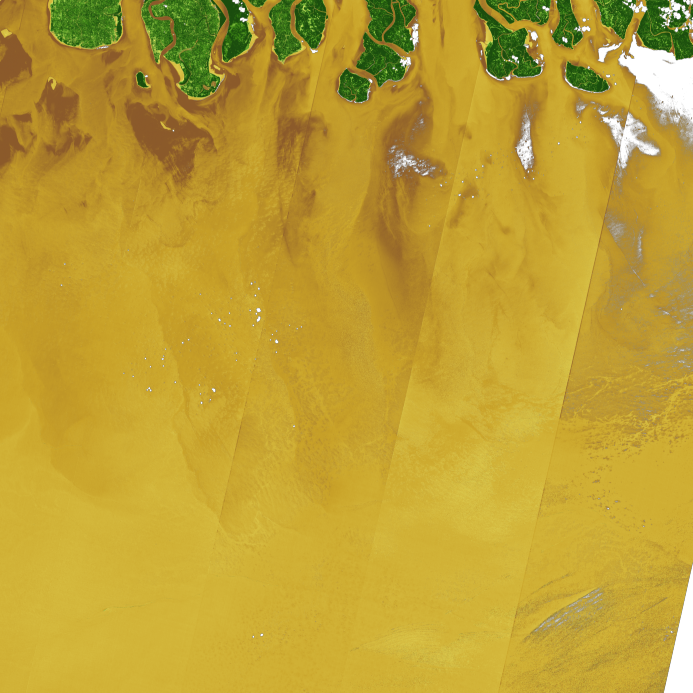
Southernmost mangrove fringe and adjacent coastline of the Indian Sundarbans, bordering the Bay of Bengal (AOI: 87.960°E to 89.028°E, 20.700°N to 21.701°N). Before masking. This tile is mostly open sea, so unmasked statistics are especially misleading here.
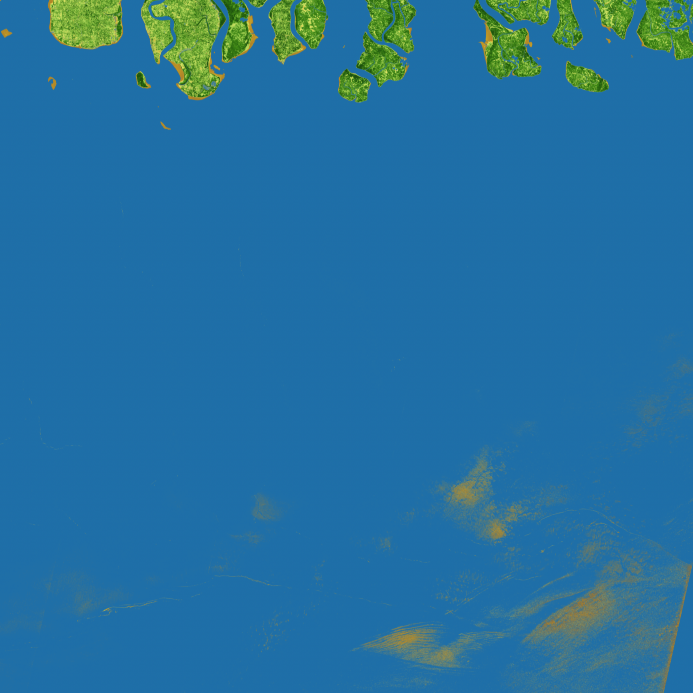
Same area after water masking. Blue = water, excluded from the stress scale. Canopy is concentrated at the northern edge, where brown, gold, green show increasing chlorophyll content, low to high.
| Mean NDRE | 0.17 |
| Median NDRE | 0.21 |
| Water, share of tile | 92.9% |
What this baseline tells us, and doesn't: this establishes the reference canopy-health state under dry-season conditions. It does not yet show whether stress is rising or falling. That comparison becomes possible starting with the next quarterly edition.
Inundation Frequency (Sentinel-1 SAR)
Tidal mangroves depend on regular flooding. A forest cut off from its normal tidal rhythm, by siltation, embankments, or altered channel flow, shows stress long before canopy browning becomes visible. This signal measures how often each part of the AOI was inundated across a full annual cycle, using radar rather than optical imagery so cloud cover and monsoon timing do not limit observation.
Method note: why radar, and why a full year
Synthetic Aperture Radar (SAR) measures the strength of a signal bounced back from the ground rather than reflected sunlight, so it works through cloud cover and at night. Open water reflects the radar pulse away from the satellite and returns a weak signal; land and vegetation return a stronger one. A single pass only shows conditions on one day. This edition uses one representative scene per month across a full year, September 2024 to September 2025, to build a frequency baseline: for each location, what share of monthly observations found it under water.
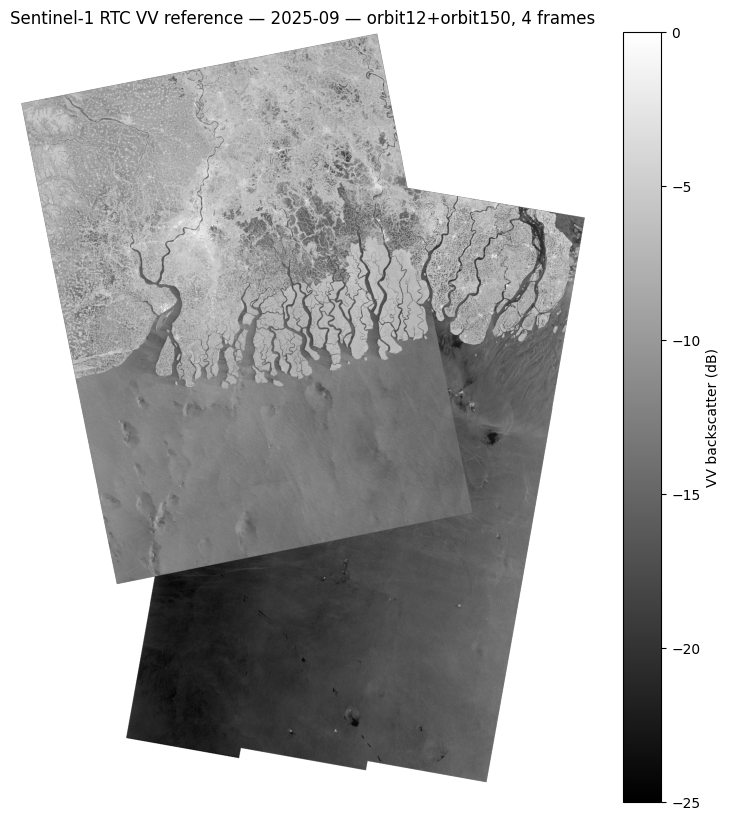
Raw Sentinel-1 VV backscatter, one representative month, orbit 12 + orbit 150 combined. Darker areas indicate a weaker radar return (typically water); lighter areas indicate a stronger return (land, vegetation, structures). This is the raw input the monthly water/land classification below is built from.
Method note: separating open sea from the tidal-transition zone
Not every part of the AOI behaves the same way. Some ground is permanently underwater (open sea, major tidal channels). Some is permanently dry (inland areas the tide never reaches). And some ground sits in between: flooded on some tidal cycles, dry on others. This in-between area is the tidal-transition zone, and it is the part of the mangrove forest most directly shaped by how often and how far tidal water reaches. The AOI spans the full Sundarbans delta, including a substantial stretch of open Bay of Bengal, so reporting one averaged figure across all three kinds of ground would blend permanent sea and permanent land into the number, hiding the actual signal of interest. Following the same logic as the canopy-stress water mask, this edition separates the AOI into the three zones below before reporting statistics.
| Zone | Definition | Share of AOI |
|---|---|---|
| Permanent water | Inundated in ≥95% of monthly observations | 48.5% |
| Permanent land | Inundated in ≤5% of monthly observations | 32.0% |
| Tidal-transition zone | Inundated in between 5% and 95% of months | 19.5% |
The tidal-transition zone is where the resilience question actually lives: mangrove forest at the boundary of regular tidal reach.
Findings: tidal-transition zone
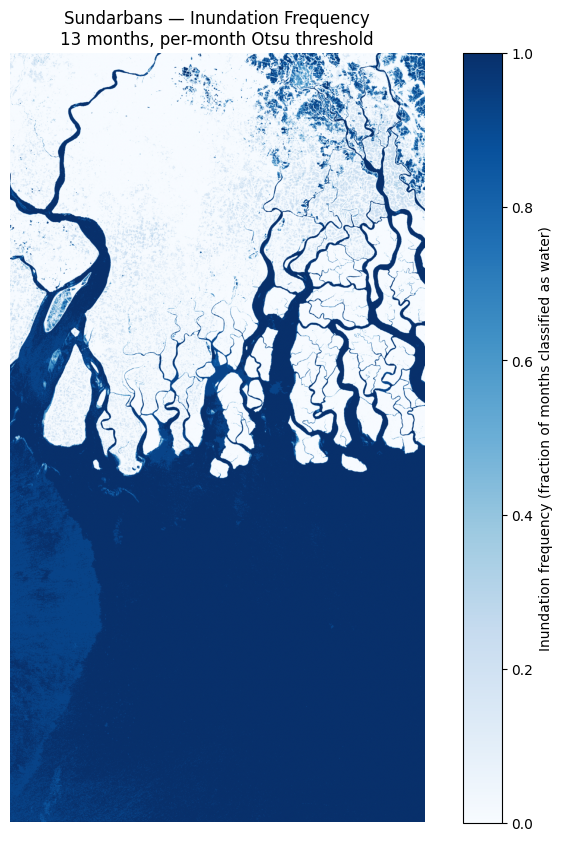
Inundation frequency across the full Sundarbans AOI, September 2024 to September 2025. Dark blue indicates near-constant inundation (open sea and major tidal channels); pale areas indicate rarely-flooded land. The tidal-transition zone, the band between these extremes, is the focus of the statistics below.
| Mean frequency | 0.55 |
| Median frequency | 0.69 |
| 10th percentile (p10) | 0.08 |
| 90th percentile (p90) | 0.92 |
A median of 0.69 means the typical transition-zone location was under water in that share of the year's monthly observations, consistent with tidal creeks and regularly flooded fringe forest. The spread from p10 to p90 reflects real variation in tidal reach across the delta, not measurement noise, and is expected in a system this hydrologically complex.
What this baseline tells us, and doesn't: this establishes the reference inundation pattern for the AOI over one full annual cycle. It does not yet show whether tidal reach is increasing, decreasing, or shifting spatially over time. That comparison becomes possible starting with the next annual edition.
Methods & Data
- Canopy stress satellite: Sentinel-2 L2A, Microsoft Planetary Computer
- Canopy stress: two tiles analyzed independently, with no pixel-level mosaicking
- Canopy stress cloud masking via Scene Classification Layer (SCL)
- NDRE = (NIR − RedEdge) / (NIR + RedEdge)
- Water mask: NDWI > 0 (McFeeters convention)
- Inundation frequency satellite: Sentinel-1 RTC (radiometrically terrain corrected), Microsoft Planetary Computer
- Inundation frequency track combination: relative orbit 12 (ascending) + relative orbit 150 (descending), all frames per date, confirmed 99.96%+ AOI coverage via geometric check
- Inundation frequency water/land threshold: Otsu's method, computed independently per month rather than a single fixed cutoff, correcting for a processing-baseline shift detected mid-series
- Inundation frequency spatial resolution: 100 metres per pixel (coarser than canopy stress's 10m, chosen for computational efficiency across a 13-month stack)
Data Records
Each canopy-stress tile (main, south) is stored in its own dated folder. Inundation frequency is stored under a single combined-AOI folder. Filenames do not repeat the tile or region name since the folder path already identifies it.
| Canopy stress raster format | Cloud-Optimized GeoTIFF (COG), single band, 32-bit float |
| Canopy stress coordinate system | WGS 84 / UTM Zone 45N (EPSG:32645), matching each source tile |
| Canopy stress spatial resolution | 10 metres per pixel |
| Canopy stress value range | -1 to 1 (NDRE, NDWI), unitless |
| Inundation frequency raster format | GeoTIFF, single band, 32-bit float |
| Inundation frequency coordinate system | WGS 84 / UTM Zone 45N (EPSG:32645) |
| Inundation frequency spatial resolution | 100 metres per pixel |
| Inundation frequency value range | 0 to 1 (fraction of months classified as water) |
| No-data convention | NaN for cloud-masked, water-masked, or invalid pixels |
| File types per index | GeoTIFF, color PNG, statistics JSON |
| Index record | metadata.json / inundation_frequency_stats.json, updated in place as each signal is refreshed |
Water-masked outputs (canopy stress) and zone-separated outputs (inundation frequency) are stored separately from their unmasked/unzoned raw index files, so both remain available.
Technical Validation
- Canopy-stress tile identity was independently confirmed against the target MGRS tile code for each scene, rather than assumed from bounding-box overlap alone.
- Canopy-stress cloud cover was checked and found consistent across two independent satellite data providers for the same scenes.
- Canopy-stress cloud masking uses the Scene Classification Layer (SCL), the standard method published by the European Space Agency for Sentinel-2 data.
- The water mask uses the original published NDWI threshold (McFeeters, 1996), not an arbitrary cutoff.
- Water-masked results were visually checked against the source imagery to confirm masked areas correspond to open water rather than vegetated land.
- Inundation-frequency AOI coverage from its two-track combination was confirmed geometrically (shapely polygon comparison against the AOI boundary), not assumed from a visual check alone, after an initial single-track approach was found to leave part of the AOI uncovered.
- A fixed backscatter threshold was tested first for inundation frequency and rejected: two months (July, September 2025) showed a uniform ~5dB shift across the entire scene, traced to a different RTC processing baseline. Otsu's method, recomputed per month, corrected for this rather than requiring every month to sit on identical radiometric footing.
Effect of water masking on measured values (canopy stress)
Comparing the main tile's unmasked and water-masked NDRE statistics shows the masking step materially changes the result, not just the visual appearance.
| Statistic | Plain NDRE (unmasked) | Water-masked NDRE |
|---|---|---|
| Mean | 0.184 | 0.252 |
| Median | 0.228 | 0.263 |
| Standard deviation | 0.169 | 0.108 |
| 10th percentile (p10) | -0.087 | 0.109 |
| Pixel count | 109,075,421 | 87,278,652 |
The 10th percentile changes sign once water is removed, from negative to positive. In the unmasked data this reads as severe vegetation stress. It is water, not stressed canopy. Roughly 20% of the tile's area is water and was excluded from the water-masked figures.
Effect of zone separation on measured values (inundation frequency)
The same principle applies here: reporting inundation frequency across the whole AOI blends permanent sea and permanent land with the actual signal of interest.
| Statistic | Whole AOI (unseparated) | Tidal-transition zone only |
|---|---|---|
| Mean frequency | 0.59 | 0.55 |
| Median frequency | 0.92 | 0.69 |
The whole-AOI median sits far closer to 1.0 than the tidal-zone median, because permanent open sea (about 48.5% of the AOI) pulls the blended figure upward. The tidal-transition-zone figure is the one that reflects actual forest-relevant hydrology.
Usage Notes
- Use the water-masked statistics for any canopy-health figure. The unmasked NDRE values include open water and will understate forest condition, particularly for the south tile.
- The two canopy-stress tiles are independent spatial units. They are not mosaicked, and totals across both tiles should be summed rather than averaged.
- Use the tidal-transition-zone statistics for any inundation-frequency figure. The whole-AOI figures include permanent open sea and will overstate typical inundation.
- Color images are stretched to each image's own value range. Do not compare colors visually across editions. Use the numeric values in the JSON or GeoTIFF files for any quantitative comparison over time.
- GeoTIFF files can be opened in QGIS, ArcGIS, or any GDAL-compatible tool. In Python, use rasterio or GDAL directly.
- This edition is a single canopy-stress dry-season snapshot and a single inundation-frequency annual baseline. A time-series comparison is not yet possible for either signal and will become available from later editions onward.
- Reuse is permitted under CC BY 4.0 with attribution to I Hug Trees.
Limitations
- Canopy stress is a single dry-season snapshot, not yet a time series
- Canopy stress's simple NDWI threshold occasionally misclassifies sediment-heavy water as land
- Canopy stress is at 10m resolution; fine detail within a single stand is not resolved
- Inundation frequency is a single 12-month baseline, not yet a multi-year time series
- Inundation frequency is at 100m resolution, coarser than canopy stress, chosen for computational efficiency across 13 monthly mosaics
- Inundation frequency's monthly water/land threshold is recomputed independently each month (Otsu), which corrects for processing-baseline drift but means the exact dB cutoff is not identical month to month
- Color scales are stretched to each image's own value range; fixed scales are planned before period-over-period comparison for either signal
What's Next
This edition brings two independently validated resilience signals together for the first time: canopy stress and inundation frequency. Together they answer not just how much mangrove exists, but whether the forest is structurally sound and whether it is still receiving the tidal water it depends on. Future editions will refresh both signals on their respective cadences (quarterly for canopy stress, annually for inundation frequency), and may add further signals as methodology for them is developed and validated to the same standard used here.
References
- McFeeters, S.K. (1996). The use of the Normalized Difference Water Index (NDWI) in the delineation of open water features. International Journal of Remote Sensing, 17(7), 1425 to 1432. doi.org/10.1080/01431169608948714
- Barnes, E.M., Clarke, T.R., Richards, S.E., et al. (2000). Coincident detection of crop water stress, nitrogen status and canopy density using ground based multispectral data. Proceedings of the Fifth International Conference on Precision Agriculture, Bloomington, MN.
- Lovelock, C.E., Feller, I.C., Reef, R., Hickey, S., & Ball, M.C. (2017). Mangrove dieback during fluctuating sea levels. Scientific Reports, 7, 1680. doi.org/10.1038/s41598-017-01927-6
- Sahana, M., Hong, H., Ahmed, R., Patel, P.P., Bhakat, P., & Sajjad, H. (2019). Assessing coastal island vulnerability in the Sundarban Biosphere Reserve, India, using geospatial technology. Environmental Earth Sciences, 78(10), 304. doi.org/10.1007/s12665-019-8293-1
- Roy, S.K., Mojumder, P., Chowdhury, M.A.A., & Hasan, M.M. (2025). Evaluating mangrove forest dynamics and fragmentation in Sundarbans, Bangladesh using high-resolution Sentinel-2 satellite images. Global Ecology and Conservation, 58, e03493. doi.org/10.1016/j.gecco.2025.e03493
- Otsu, N. (1979). A threshold selection method from gray-level histograms. IEEE Transactions on Systems, Man, and Cybernetics, 9(1), 62 to 66. doi.org/10.1109/TSMC.1979.4310076
These references support the methods used in this report (NDWI, NDRE, Otsu thresholding) and the scientific basis for the resilience signals this site publishes. They are cited for context and do not represent findings by I Hug Trees.
Download Data
- Canopy stress: NDRE GeoTIFF (COG), main tile
- Canopy stress: NDRE GeoTIFF (COG), south tile
- Canopy stress: NDWI GeoTIFF (COG), main tile
- Canopy stress: NDWI GeoTIFF (COG), south tile
- Canopy stress statistics (JSON), main tile
- Canopy stress statistics (JSON), south tile
- Inundation frequency color map (PNG)
- Inundation frequency GeoTIFF
- Inundation frequency statistics (JSON)
How to Cite This Report
Yaragarla, R. (2026). Mangrove Forest Resilience: Sundarbans, India. Hug Analytics, I Hug Trees. Available at https://ihugtrees.org/data-analytics/sentinel-ndvi/Sundarbans-India-region/2026/04/10/digest.html.
Canopy-stress raw satellite tiles: Copernicus Data Space Ecosystem (CDSE), Microsoft Planetary Computer (MPC). Inundation-frequency raw satellite tiles: Microsoft Planetary Computer (MPC). Data extraction, processing, analysis and reporting: Hug Analytics, I Hug Trees.
BibTeX
@misc{ihugtrees_mangrove_sundarbans_2026,
  author = {Yaragarla, Ramkumar},
  title = {Mangrove Forest Resilience: Sundarbans, India},
  year = {2026},
  publisher = {Hug Analytics, I Hug Trees},
  url = {https://ihugtrees.org/data-analytics/sentinel-ndvi/Sundarbans-India-region/2026/04/10/digest.html},
  note = {Canopy-stress tiles: CDSE, MPC. Inundation-frequency tiles: MPC.}
}
License
This report and its data are published under Creative Commons Attribution 4.0 International (CC BY 4.0). Reuse is permitted with attribution.