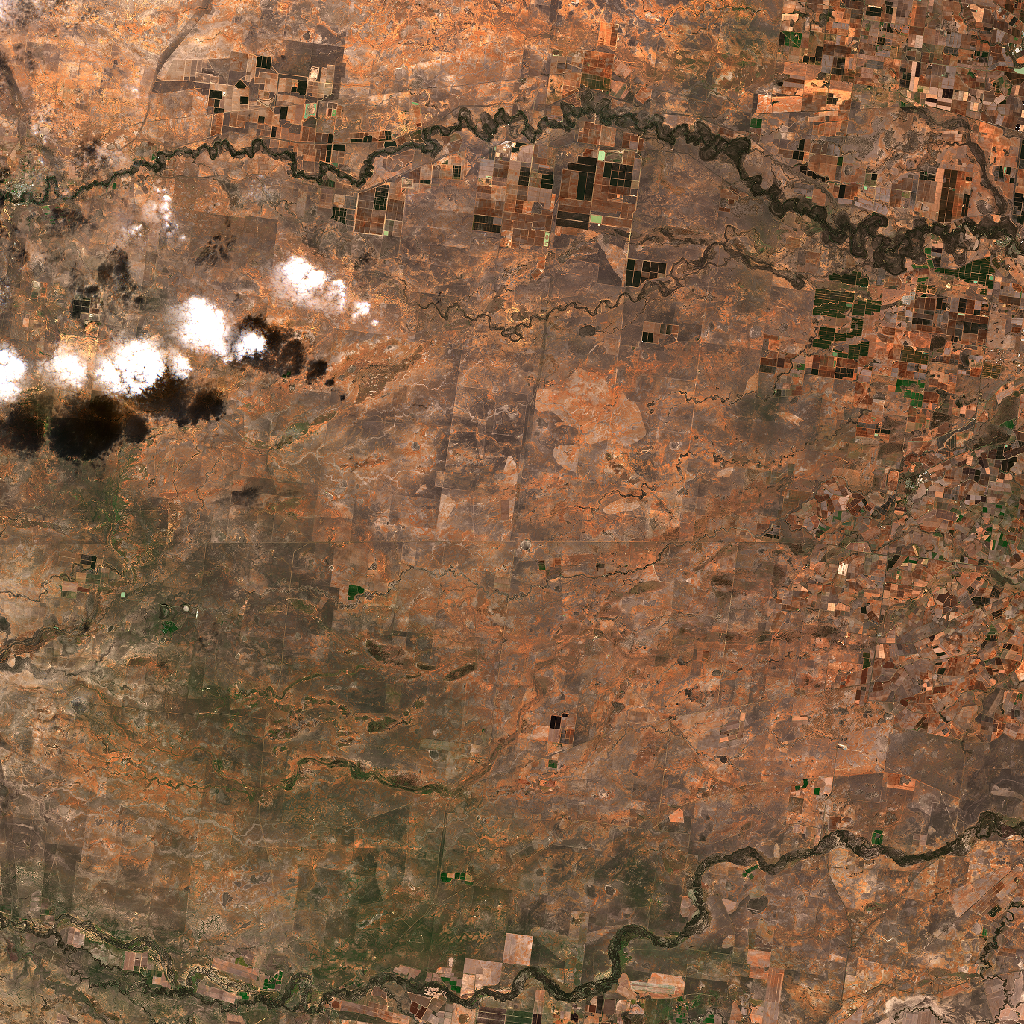
Sentinel-2 satellite preview of Australia-DarlingtonPoint-Coleambally-Bundure-part2-region, captured on 2026-04-16 from an altitude of approximately 786 km.
Statement of Problem
Climate variability, agricultural intensification, and population growth are placing unprecedented pressure on river basins worldwide. Understanding water extent, flood vulnerability, and riparian ecosystem health is essential for sustainable water management, agricultural planning, and disaster preparedness. This analysis quantifies current water resources in Australia-DarlingtonPoint-Coleambally-Bundure-part2-region, identifies inundation-prone zones, assesses riparian vegetation health, and provides evidence-based recommendations for water management and flood risk mitigation.
Regional Context: Darlington Point-Coleambally-Bundure
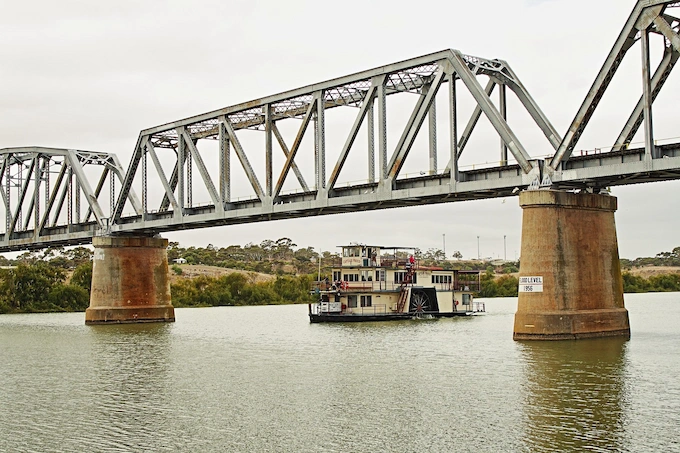
Murray River near the Murrumbidgee region. Image by Keith Clarkson from Pixabay.
The Murray River and the Murrumbidgee River come together near the Darlington Point area, shaping the land and supporting farming communities.
Together, these rivers form the Murray–Darling Basin, one of Australia’s most important river systems.
Supporting Australia’s Food Bowl for the Future
The Darlington Point, Coleambally, and Bundure region sits in the Murrumbidgee Valley, which is part of the Murray–Darling Basin. This basin is Australia’s largest river system. It produces around 40 percent of the country’s agricultural output, worth about 24 billion dollars each year, and supplies water to more than 2.4 million people.
The Coleambally Irrigation Area is one of the most productive farming regions in the basin. Good water management has helped farms grow food reliably in a dry landscape. Water is central to everything here, and careful planning has always made a difference.
Today, the region is under growing pressure from climate change. Over the past fifty years, the basin has slowly become hotter and drier. River inflows have reduced, and future projections raise serious concerns. In the southern parts of the basin, water availability is expected to decline further. Droughts are also likely to become more frequent and more severe.
As water becomes scarcer, competition has increased between agriculture, the environment, and local communities. During long dry periods, there is often not enough water to meet every need. The Millennium Drought from 2000 to 2010 clearly showed how exposed the region is, and recent dry years have reinforced that message.
These challenges highlight the need for smarter and more flexible water management. Protecting farm livelihoods while keeping rivers healthy will depend on how well the region adapts to a drier and more uncertain future
Using Smarter Tools to Manage Water
Water management in the Murray–Darling Basin has improved since the Millennium Drought. New systems now help share water more fairly and respond better during dry periods.
Programs like Reconnecting River Country are working to reconnect rivers with wetlands and floodplains in the Murray and Murrumbidgee valleys. This work aims to support healthy rivers while allowing farming to continue.
Satellite data plays an important role in this process. It shows where water is present, how healthy riverbank vegetation is, and which areas are at risk of flooding.
This information helps managers make better decisions, especially as water becomes scarcer. With the 2026 Basin Plan Review approaching, clear and reliable data is key to protecting both farms and rivers in a changing climate.
Key Information Sources:
- Murray-Darling Basin Authority: Basin Overview | 2025 Basin Outlook | 2026 Basin Plan Review
- CSIRO Murray-Darling Basin Sustainable Yields (2025): Climate Change Impacts Report
- NSW Government Water: Reconnecting River Country Program
- Wikipedia: Murray-Darling Basin
1. Water Resources & Riparian Vegetation Assessment
SECTION 1: WATER & VEGETATION STATUS
1.1 Riparian Vegetation Health (NDVI Analysis)
The analysis of NDVI statistics for the riparian corridors in the Australia-DarlingtonPoint-Coleambally-Bundure-part2 region reveals a mean NDVI value of 0.18 and a median of 0.17, indicating moderate health of the riparian vegetation along waterways. Specifically, the 10th percentile (p10) NDVI value is 0.12, while the 90th percentile (p90) is 0.24, suggesting variability in vegetation health. Healthy riparian vegetation, typically characterized by NDVI values between 0.3 and 0.8, plays a crucial role in stabilizing river banks and enhancing ecosystem health. The observed NDVI values, although below the optimal range for healthy vegetation, indicate the presence of riparian zones that could benefit from targeted restoration efforts to improve bank stability and ecosystem resilience. For a detailed visualization, refer to the NDVI color map here.
1.2 Water Extent Assessment (NDWI & MNDWI)
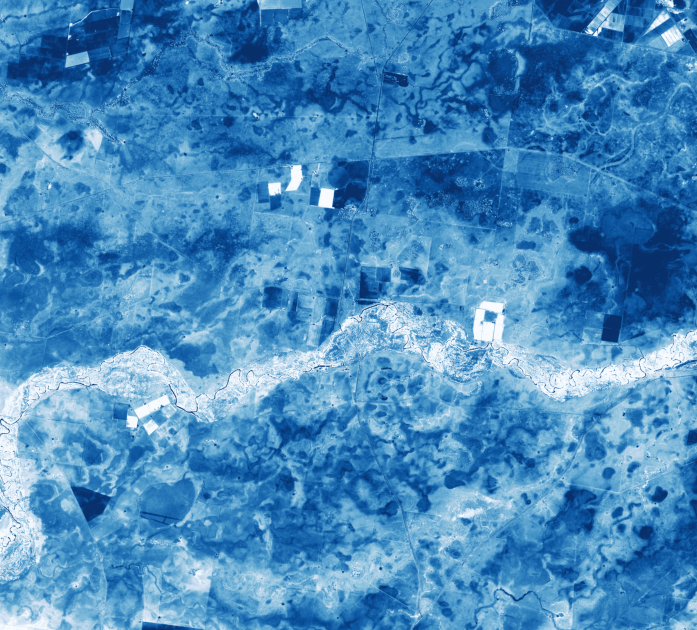
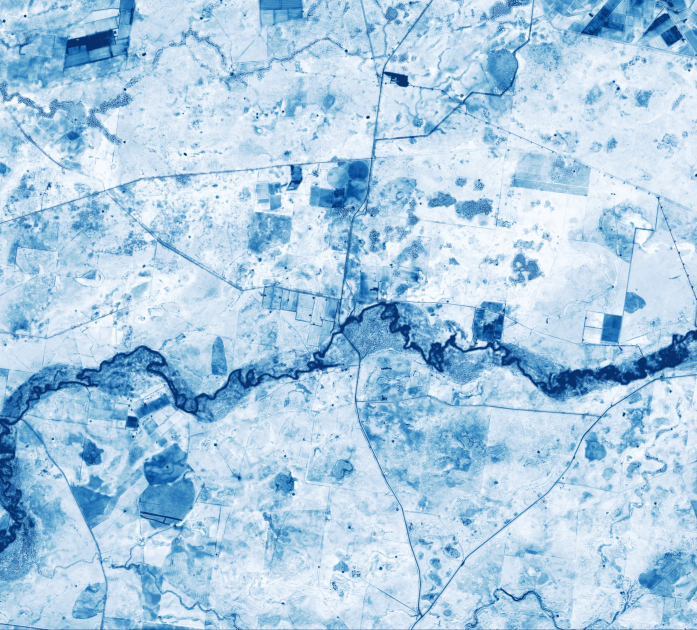
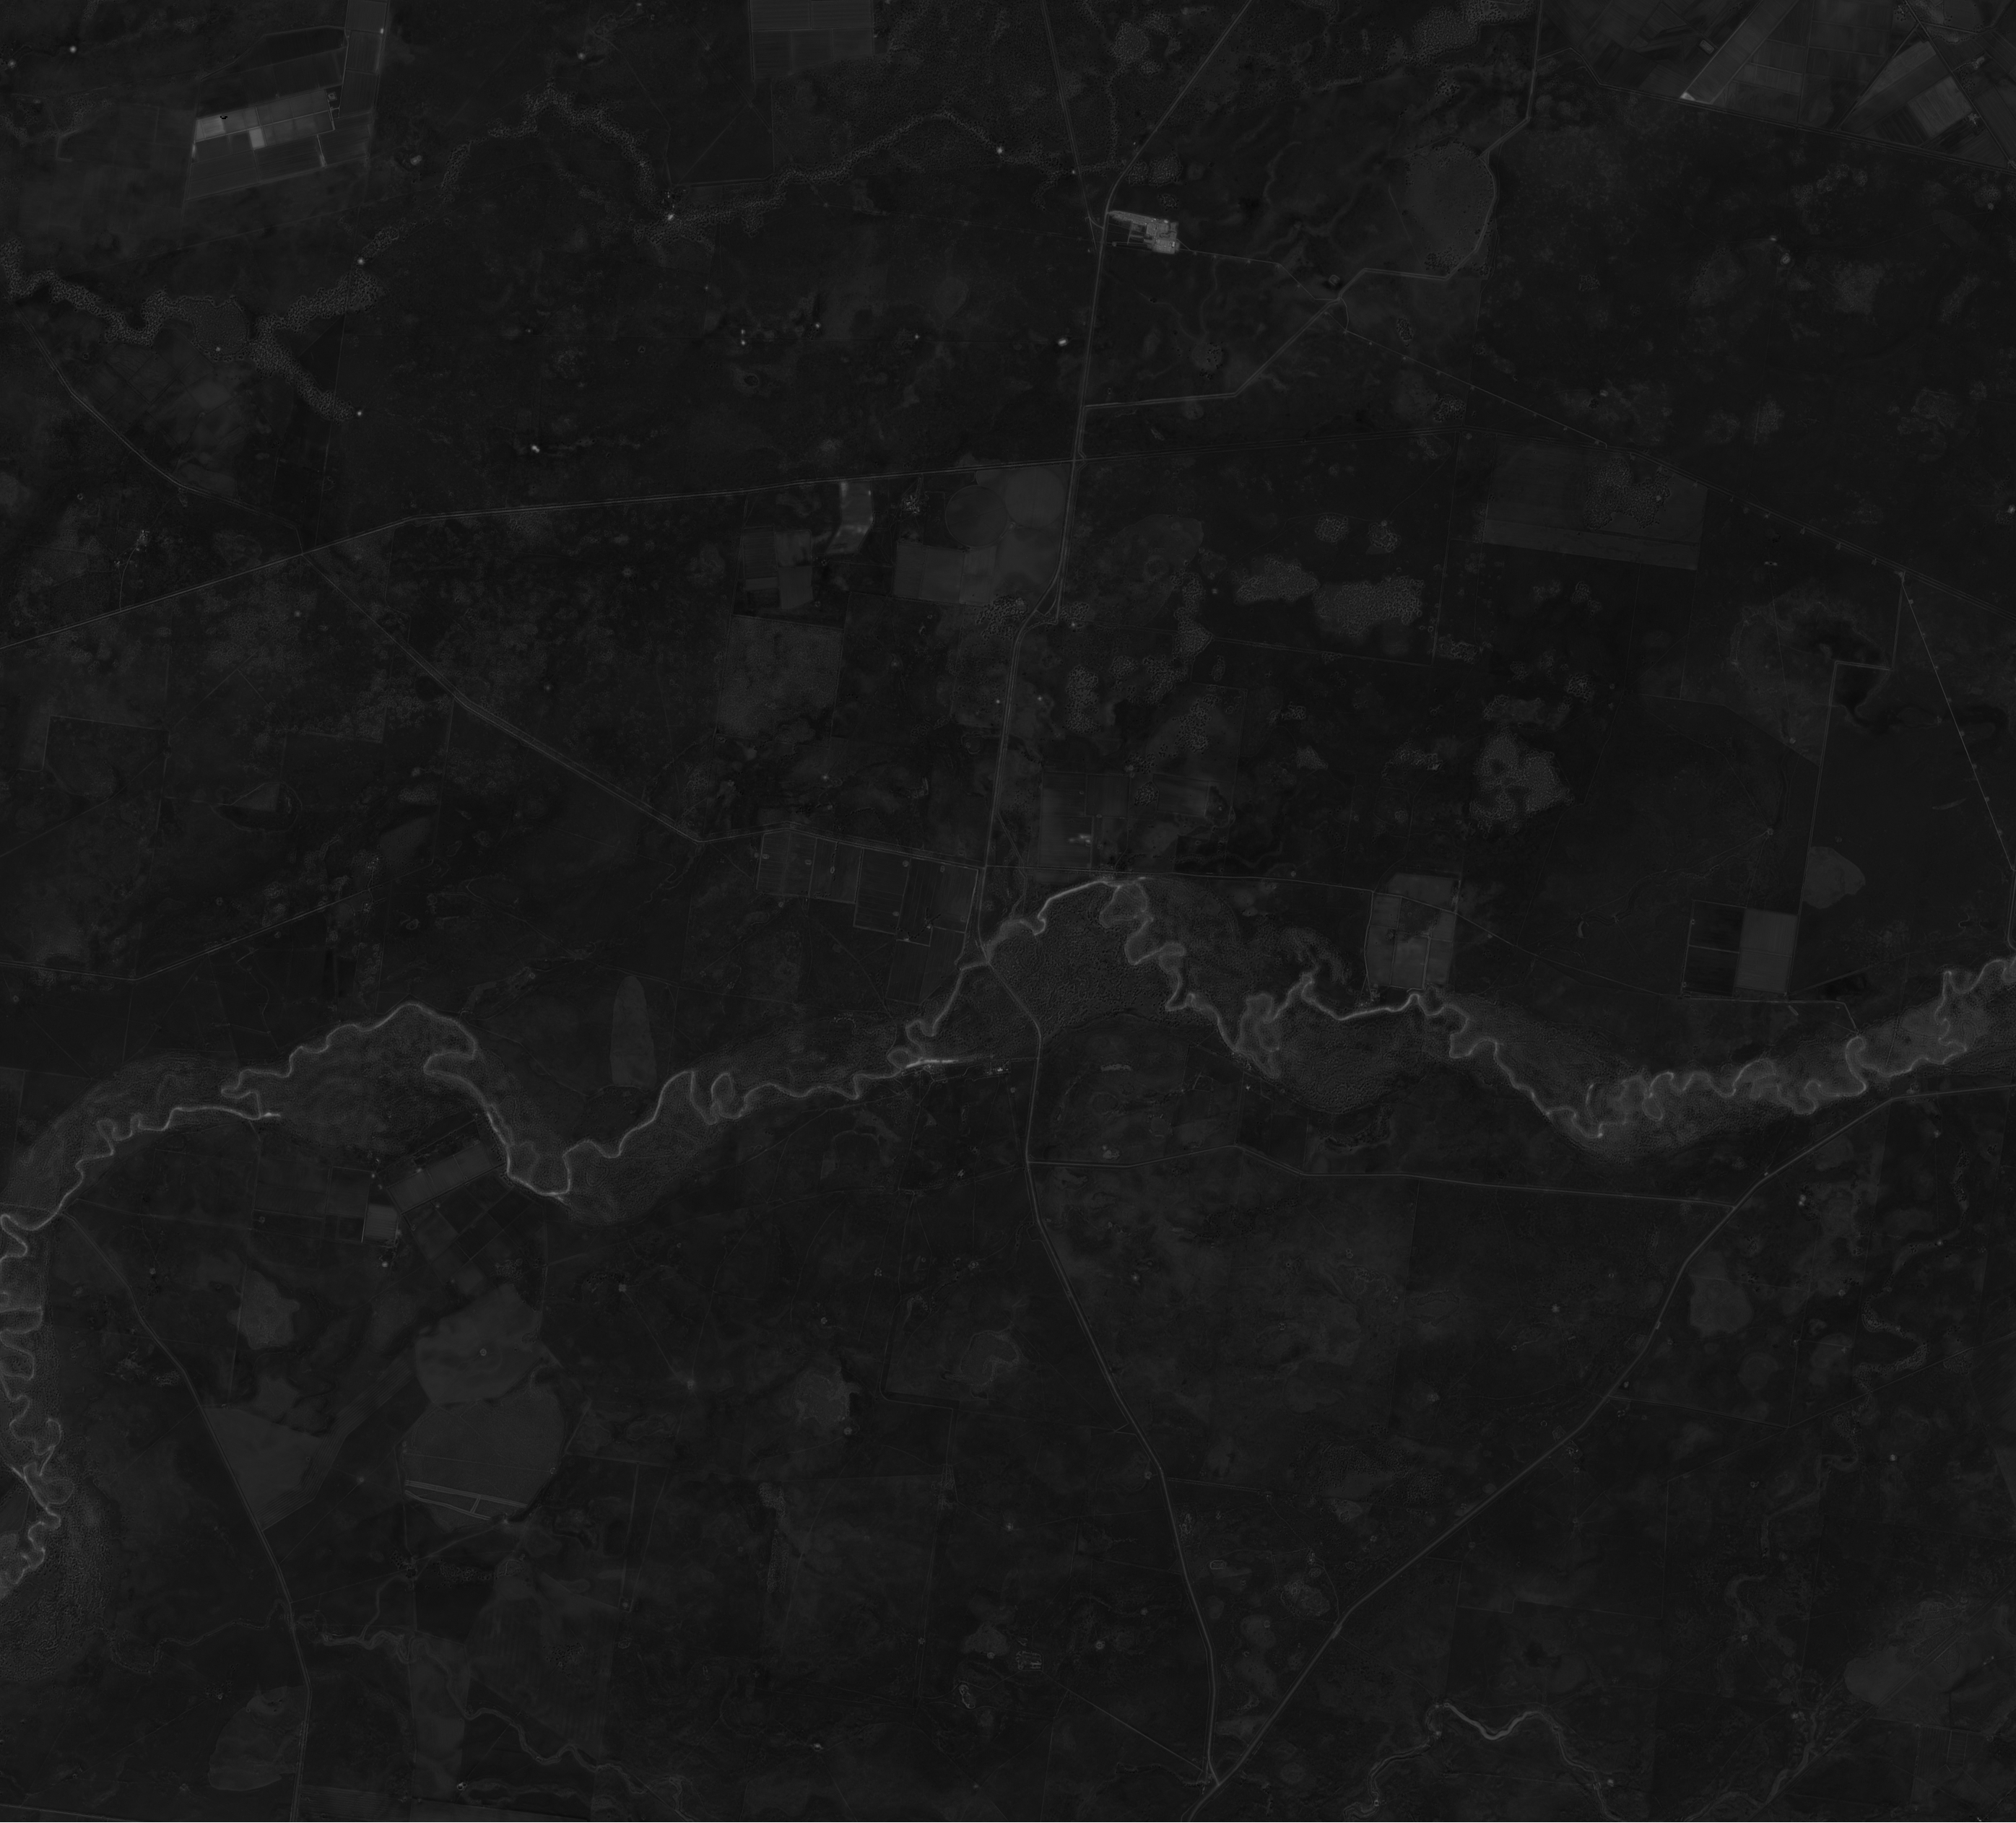
The water extent assessment utilizing both NDWI and MNDWI indices provides a comprehensive view of water presence and characteristics within the region. The NDWI statistics show a mean value of -0.26, with a range from -0.66 to 0.30, indicating variable water presence across the area. Positive NDWI values suggest water presence, with higher values indicating more water. The MNDWI, designed for enhanced detection of water, especially in turbid or sediment-laden conditions, shows a mean value of -0.41, ranging from -0.57 to 1.0. The comparison between NDWI and MNDWI reveals differences in water detection capabilities, with MNDWI offering a more nuanced view of water bodies, including those with higher sediment loads. Spatial distribution patterns, as depicted in the NDWI and MNDWI maps, show areas of concentrated water presence and potential sediment-rich zones. For detailed visualizations, refer to the NDWI map here and the MNDWI map here.
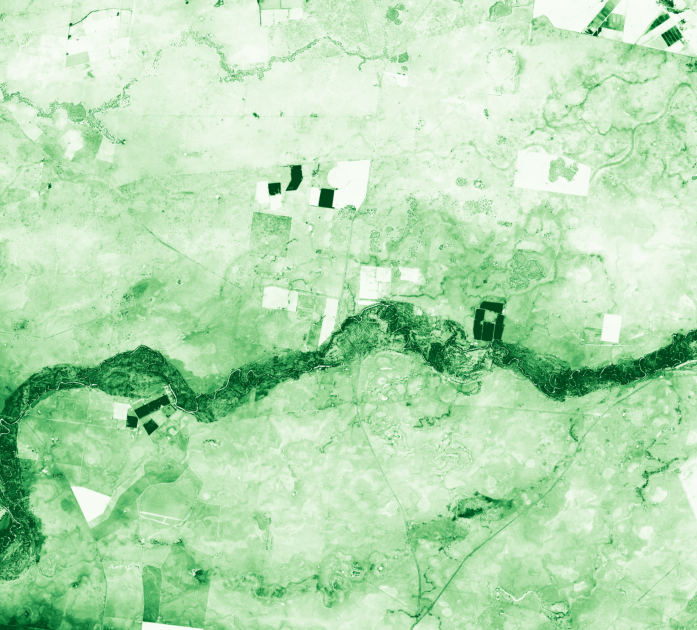
NDVI Color Visualization (Riparian Vegetation)
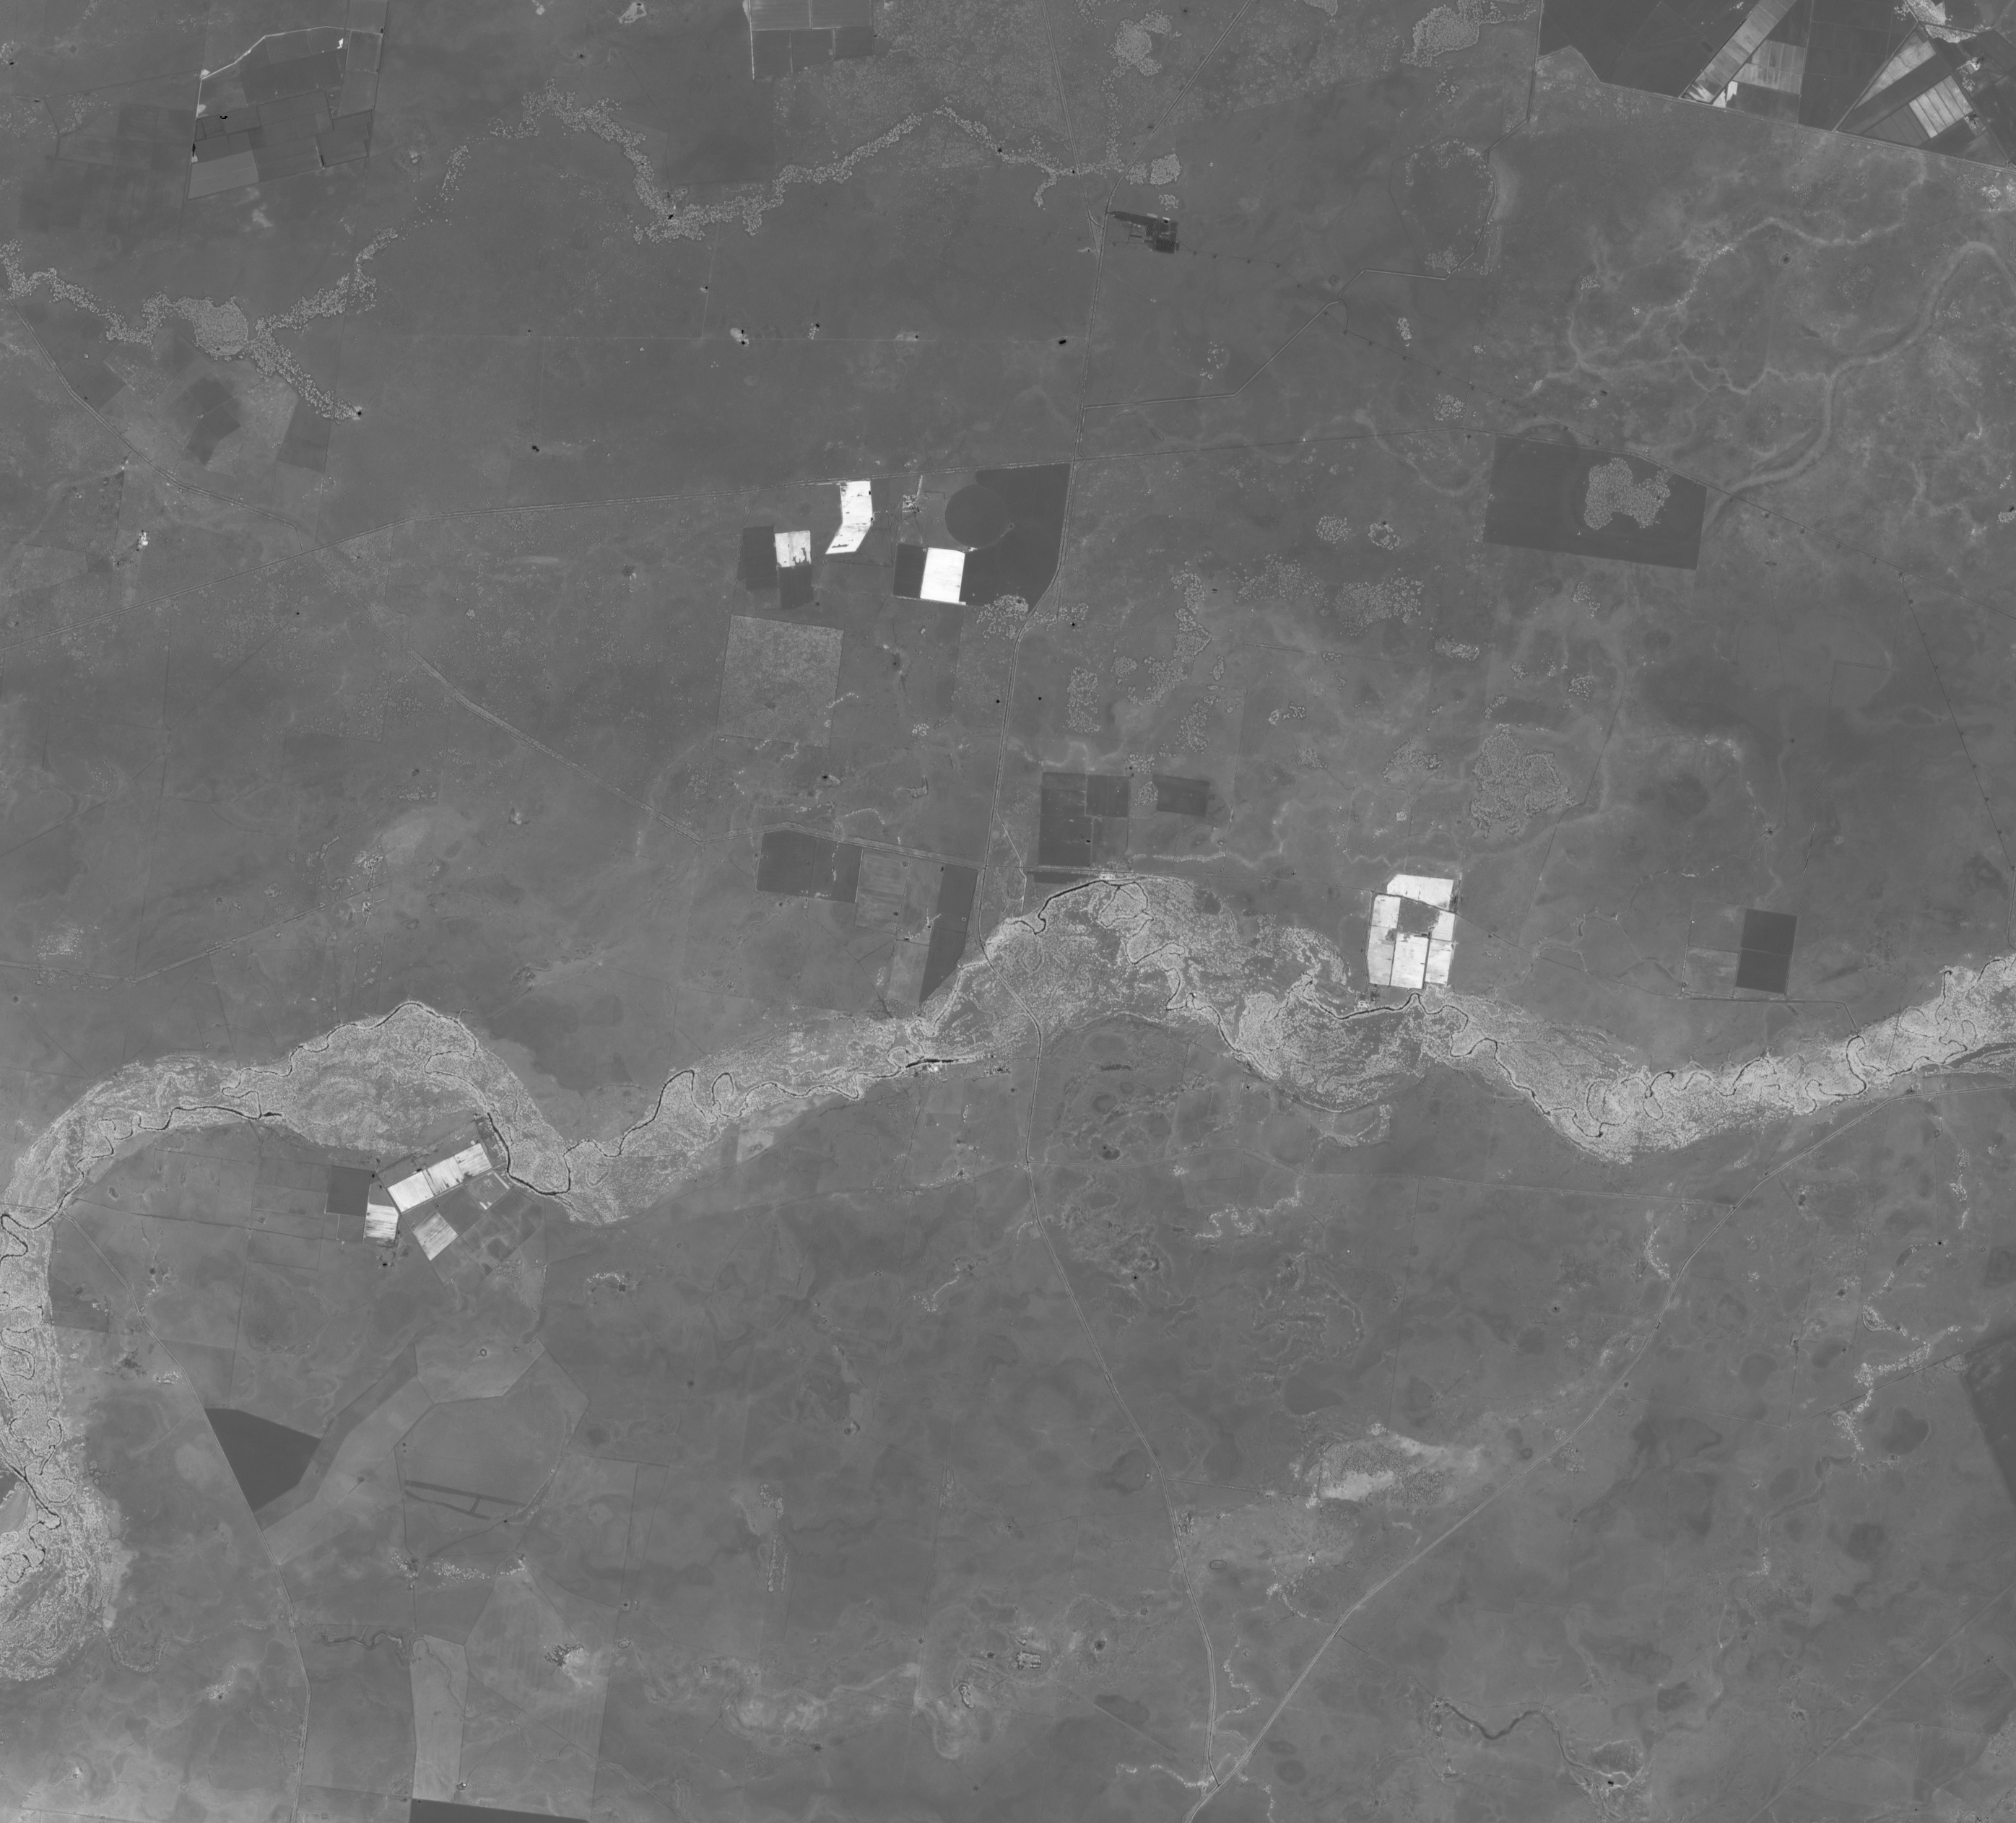
NDVI Greyscale (Index Values)
NDWI (Standard Water)
MNDWI (Enhanced Water)
MNDWI Greyscale
2. Water Characteristics Analysis
SECTION 2: WATER CHARACTERISTICS ANALYSIS
2.1 MNDWI-NDWI Difference Analysis
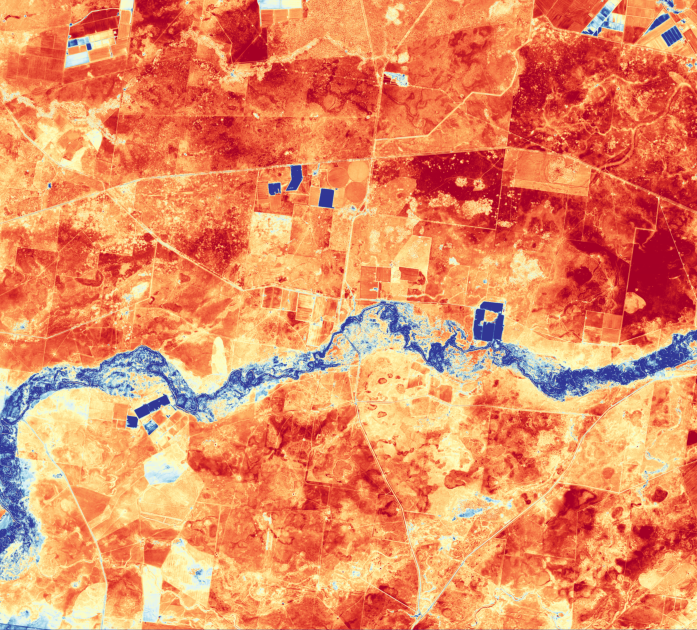
The MNDWI-NDWI difference analysis, derived from the water_diff_bins JSON, offers insights into the water characteristics across the region. The mean difference is -0.15, with values ranging from -0.46 to 1.46. Positive differences, constituting 8.1% of the area, indicate zones with turbid or sediment-rich water, suggesting areas where sediment transport and deposition are significant. Conversely, negative differences, representing 91.9% of the area, suggest clearer water conditions. This analysis is crucial for understanding water quality and the dynamics of sediment transport within the river basin. For a visual representation of these differences, refer to the difference map here and the legend here.
2.2 Combined Water Index Interpretation
The overlay image, which combines both NDWI and MNDWI indices, reveals distinct patterns and areas where the readings diverge. This divergence highlights zones with varying water clarity and sediment load, providing a comprehensive view of the water characteristics across the region. For a detailed view of these patterns, refer to the combined overlay here.
MNDWI-NDWI Difference Map (reveals water turbidity and sediment)
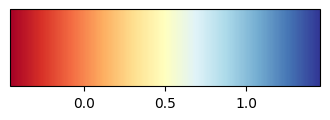
Legend
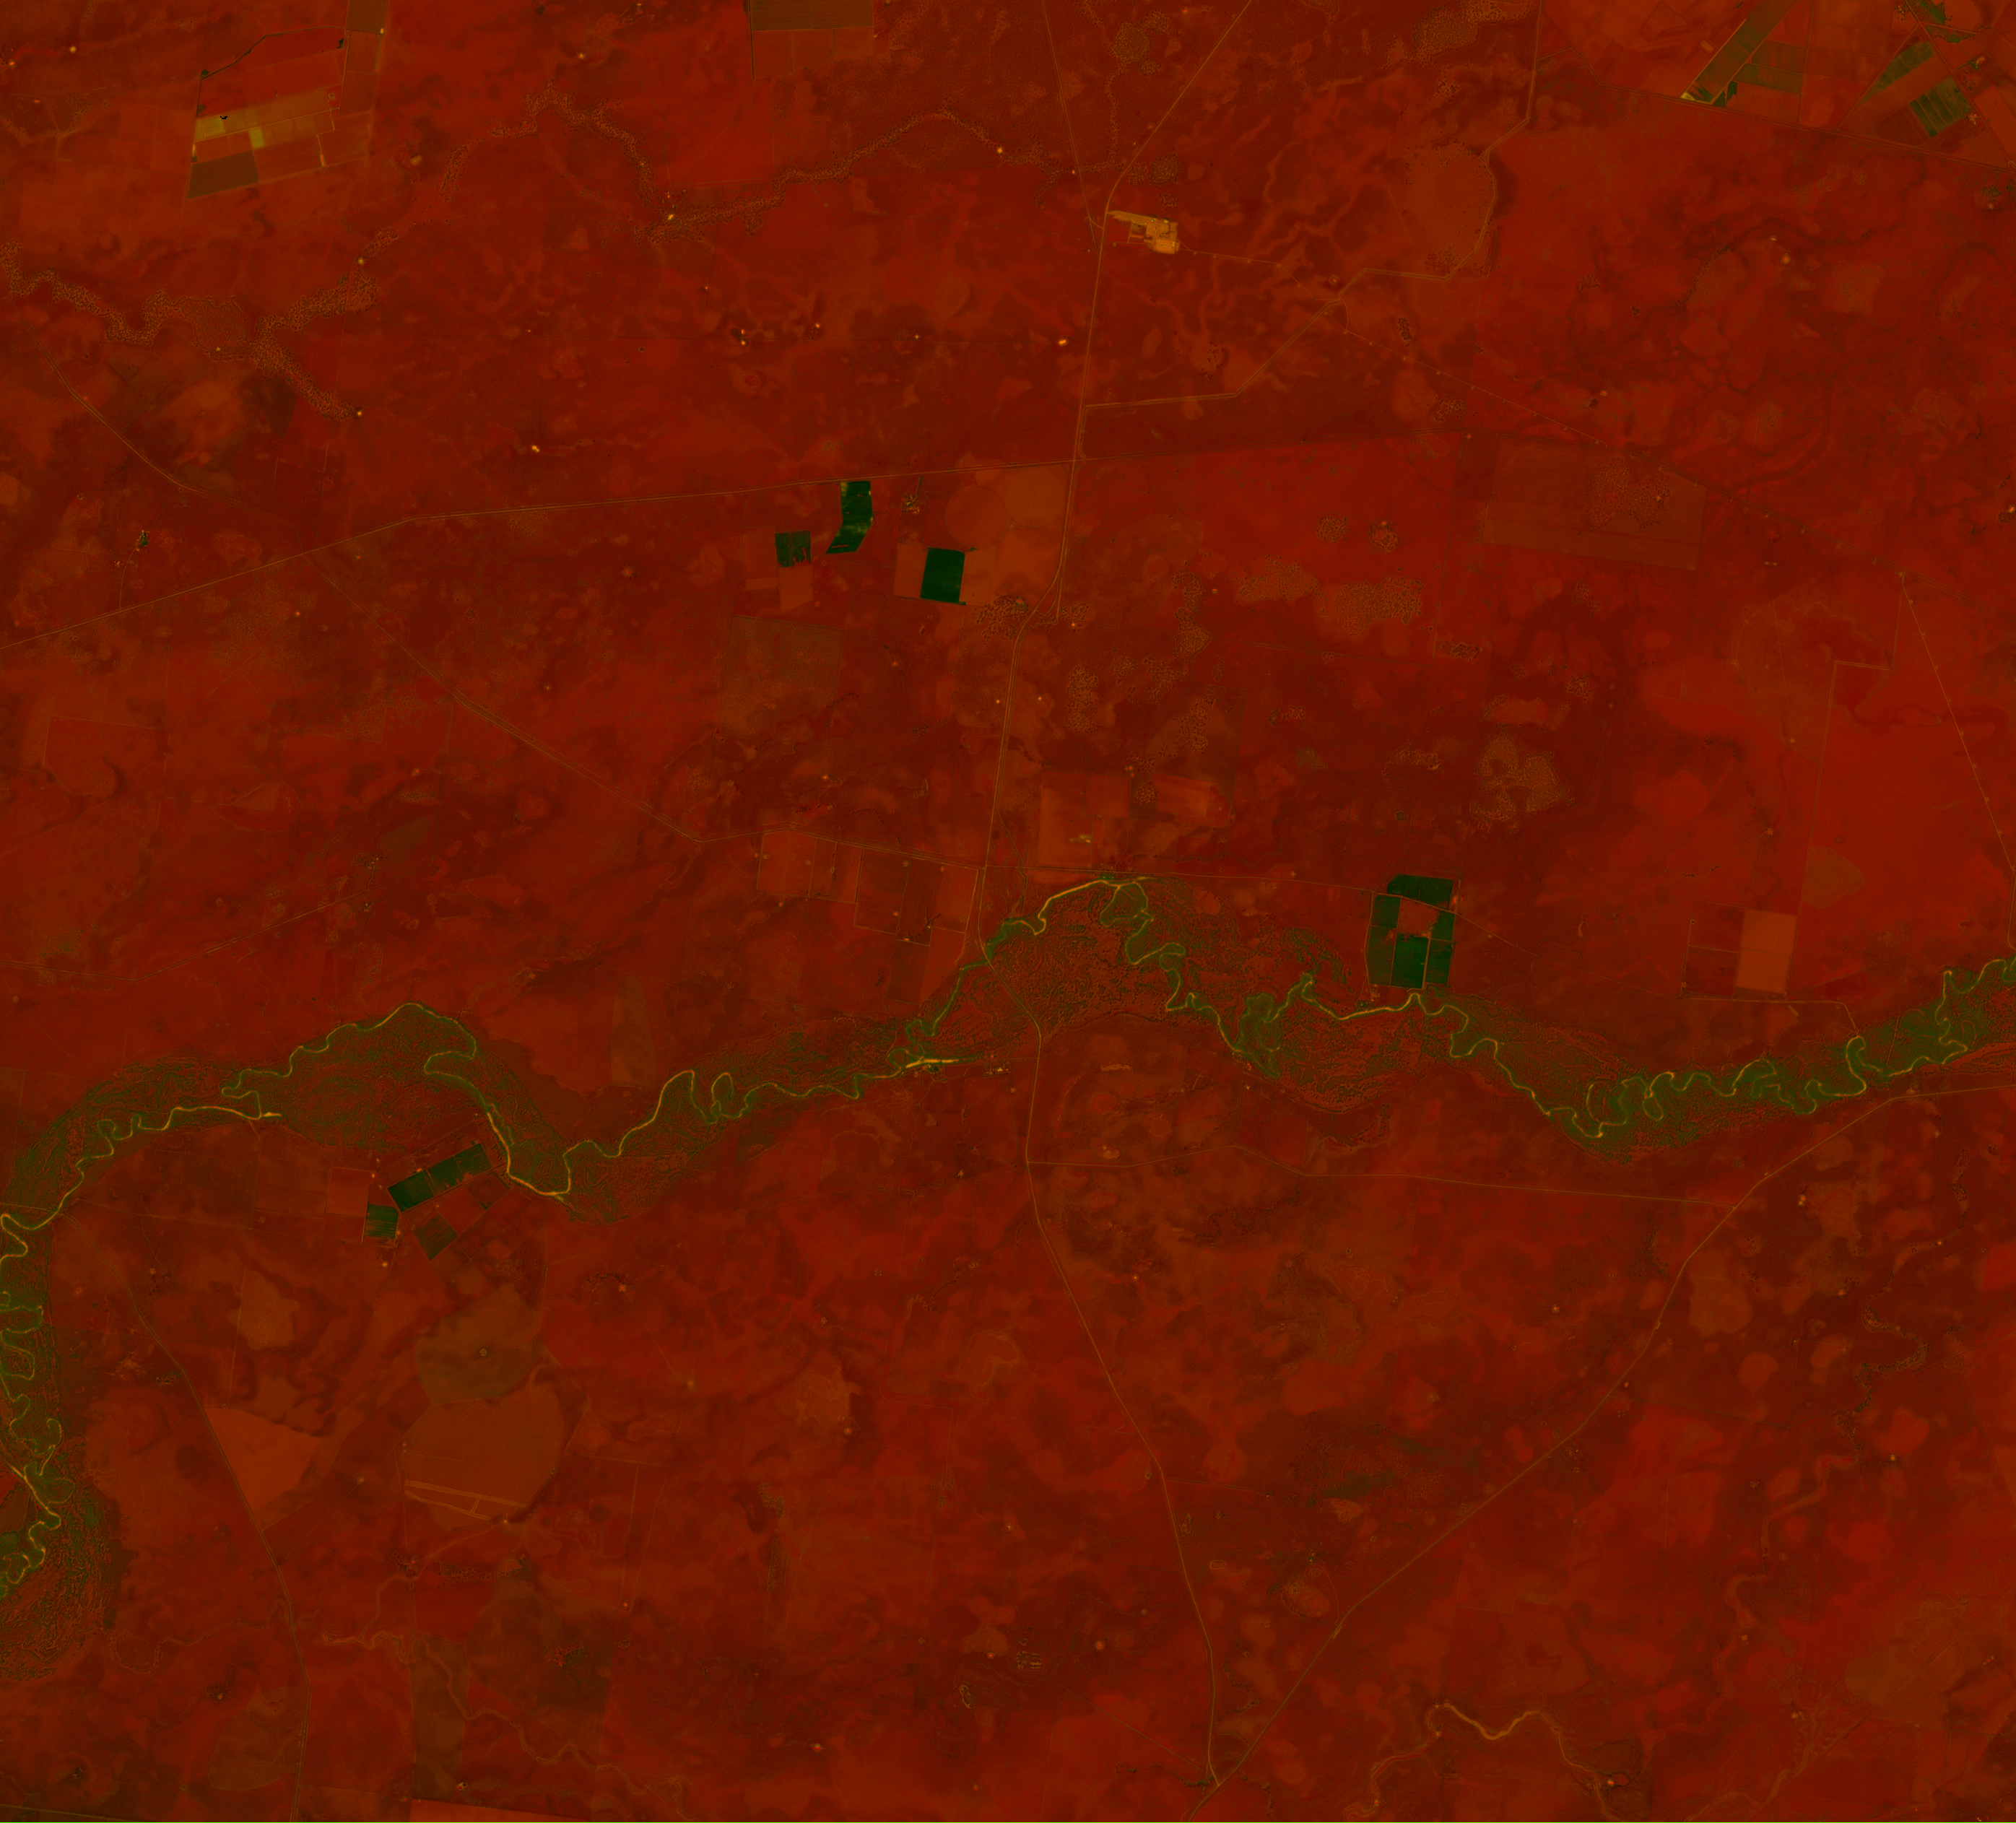
Combined MNDWI-NDWI Overlay
3. Flood Risk & Inundation Vulnerability
SECTION 3: FLOOD RISK ASSESSMENT
3.1 Inundation Zone Mapping
The inundation zone mapping, based on the inundation_bins JSON, identifies areas at varying risk of flooding within the Australia-DarlingtonPoint-Coleambally-Bundure-part2 region. The analysis reveals that 99% of the area is classified as dry, with only 0.04% identified as inundated. This low percentage of inundated areas suggests that, at the time of observation, the region was not experiencing widespread flooding. However, the identification of specific inundated zones is critical for understanding flood vulnerability. These areas, though currently minimal, could be at higher risk during periods of increased rainfall or river flow. The implications for agriculture, infrastructure, and water management are significant, highlighting the need for targeted flood mitigation strategies in these vulnerable zones. For a detailed view of the inundation zones, refer to the inundation map here and the legend here.
3.2 Key Findings & Water Management Implications
- Mean NDVI value of 0.18 indicates moderate riparian vegetation health.
- MNDWI mean of -0.41 suggests variable water presence, with enhanced detection of sediment-laden water bodies.
- Inundation analysis shows minimal flooding at the time of observation, with 0.04% of the area classified as inundated.
- MNDWI-NDWI difference highlights areas with turbid water, indicating potential sediment transport zones.

Inundation Risk Map (Red = high flood vulnerability)
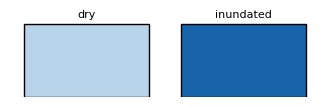
Legend
4. Water Management Recommendations
SECTION 4: RECOMMENDATIONS
4.1 Current Strengths
- The presence of riparian zones, albeit with moderate NDVI values, suggests potential areas for vegetation restoration to enhance bank stability.
- The low percentage of inundated areas at the time of observation indicates effective natural water management in most parts of the region.
4.2 Critical Challenges
- Areas with lower NDVI values (<0.3) indicate degraded riparian vegetation, which may compromise bank stability and ecosystem health.
- Zones identified with positive MNDWI-NDWI differences suggest high sediment loads, which could impact water quality and aquatic habitats.
- Although minimal at the time of observation, the identified inundated zones highlight potential flood vulnerabilities that require attention.
4.3 Water Management Recommendations
- Implement targeted riparian restoration projects in areas with degraded vegetation to improve bank stability and ecosystem resilience.
- Develop and implement flood risk mitigation strategies for identified vulnerable zones, including infrastructure improvements and natural buffer enhancements.
- Establish a water quality monitoring program to regularly assess sediment loads and water clarity, especially in zones with high MNDWI-NDWI differences.
Analysis Coverage Area
The interactive map below shows the exact geographical bounds of this satellite analysis. The overlay represents the water indices coverage area overlaid on OpenStreetMap. You can zoom and pan to explore how the analysis boundaries align with rivers, floodplains, and agricultural areas in Australia-DarlingtonPoint-Coleambally-Bundure-part2-region.
Note: The analysis boundaries may extend beyond specific river channel limits as they represent the satellite image crop captured on 2026-04-16. This ensures comprehensive coverage of the river basin, floodplains, and surrounding agricultural areas for complete water resources and flood risk assessment.
Why Water Resources Monitoring Matters
Rivers and wetlands are lifelines for agriculture, ecosystems, and communities. Accurate monitoring of water extent, flood risk, and riparian vegetation health is essential for sustainable water management, agricultural planning, and disaster preparedness. As climate variability intensifies drought-flood cycles, satellite remote sensing provides critical data for understanding water availability, identifying flood-vulnerable areas, and protecting riparian ecosystems.
The Normalized Difference Water Index (NDWI) and Modified NDWI (MNDWI) quantify water presence and extent across river basins. NDVI tracks riparian vegetation health—a key indicator of bank stability and ecosystem function. Together, these indices reveal seasonal water patterns, inundation zones, and the balance between water resources and land use.
Understanding NDWI, MNDWI, and NDVI
NDWI (Normalized Difference Water Index) uses green and near-infrared bands to detect water bodies. Positive values indicate water presence, with higher values representing deeper or clearer water. NDWI is effective for general water extent mapping.
MNDWI (Modified NDWI) replaces the green band with a shortwave infrared band, making it more sensitive to turbid, sediment-laden, or shallow water. MNDWI better distinguishes water from built-up areas and vegetation, particularly in agricultural or developed floodplains.
NDVI (Normalized Difference Vegetation Index) measures vegetation health in riparian zones—the vegetated corridors along waterways. Healthy riparian vegetation (NDVI 0.3-0.8) stabilizes banks, filters runoff, and supports biodiversity. Degraded riparian zones increase flood risk and erosion.
README Note
Our Mission: We want this research dataset brief to be Simple, Authentic, and Repeatable.
1. Title of the Dataset
Urban Green Cover and Heat Risk Assessment
2. What This Dataset Is About
This dataset was created to help anyone understand how vegetation and green cover in this region is changing over time. It brings together processed satellite data, simple calculations, and a few observations that give the bigger picture.
3. Why This Dataset Matters
At I Hug Trees, we believe that Geospatial Satellite imagery and processed data should be accessible to everyone. While grounded in scientific principles, outputs are presented in accessible formats so that technical imagery and calculations resonate with ordinary people and communities. Because only when it is relatable, can it tell clear stories about our greenery and urban life: shaping how we live, how we breathe, and how we cope with rising heat.
This dataset tries to make that easier. Whether you are a researcher, policy maker, student or just curious about the environment, these numbers and images help you see trends that are not obvious at first glance.
4. Source of the Data
- Satellite: Sentinel-2
- Provider: Microsoft Planetary Computer
- Acquisition Window: Past 60 days (filtered by cloud cover)
- Cloud Cover Threshold: < 30%
- Initial Tile Discovery: Copernicus Data Space Ecosystem browser
5. How the Data Was Processed
Basic Preprocessing:
It is important to get the right tile from the Sentinel-2 database for imagery processing. The browser feature from the Copernicus Data Space Ecosystem helped us identify the correct tile, its bounds, and the subset coordinates needed for extraction. It is always essential to double-check the preview image to verify that the fetched tile truly corresponds to the target region.
Next, we used an AWS Lambda environment for the bounds-discovery phase. This step involved fetching band data from the Microsoft Planetary Computer for dates where cloud cover was below 30% within the past 60 days. Once the acquisition date met this condition, we moved to AWS EC2 server scripts written in Python to download raw band data and process them into COGs (Cloud Optimised GeoTIFFs) along with additional indices.
These processed COGs and index outputs are then used for image displays, NDVI interpretation, and HTML digest features published on our platform. All indices raw value outputs are in JSON files for easy repeatable processing. We currently run this workflow on a quarterly schedule for each identified region.
Cloud Masking:
This dataset uses Sentinel-2's Scene Classification Layer (SCL) to remove pixels affected by clouds, shadows, haze, and saturation. Only surface-clear classes are kept, ensuring that the vegetation indices are calculated from clean, reliable pixels. The masking is applied at the pixel level, meaning every index (NDVI, EVI, etc.) is computed only on valid areas after stripping away noisy regions. This results in more trustworthy COGs, cleaner previews, and more meaningful temporal comparisons.
Calculation Formulas Used:
NDVI = (NIR − Red) ÷ (NIR + Red)EVI = 2.5 × (NIR − Red) ÷ (NIR + 6×Red − 7.5×Blue + 1)NDWI = (Green − NIR) ÷ (Green + NIR)NDBI = (SWIR1 − NIR) ÷ (SWIR1 + NIR)
Tools Used:
Data Source: Microsoft Planetary Computer (Sentinel-2 L2A), rasterio, GDAL
Computation: Python 3, NumPy, SciPy, Pillow, Rasterio, rio-cogeo
AWS Pipeline: Lambda (triggers), EC2 (processing), S3 (storage), Bedrock (AI summaries)
Mapping: Leaflet.js, tile layers served from S3
Automation: Python boto3, Cron (EC2 quarterly jobs)
6. File Contents
The dataset includes metadata.json with satellite tile information, various index outputs
(NDVI, EVI, NDWI, NDBI, MNDWI, NDMI), and statistical summaries. Please find the detailed list of files
available for download in the Download Data & Maps section below.
7. How to Use This Dataset
You can explore the NDVI trends, plug the json file into your favourite tool, build visualisations, or compare it with earlier datasets. It's created to be flexible.
8. Leveraging AI
AI helped speed up some parts of the work, like spotting unusual patterns, creating brief insights, and checking for inconsistencies. All metadata and bin-statistics JSON files were loaded and parsed into structured dictionaries, ensuring the AI receives clean, context-rich inputs for stable summarisation and interpretation.
9. Limitations & Things to Keep in Mind
- Cloud cover may affect accuracy
- NDVI has known limitations
- Spatial resolution is 10 meters
- Some patterns may need ground truth validation
10. License / Permissions
Please refer to the How to Cite This Analysis section below for citation guidelines. This dataset is licensed under Creative Commons Attribution 4.0 International (CC BY 4.0).
11. Contact
For any questions, collaborations, or clarifications, feel free to reach out at: nature@ihugtrees.org
Data & Methods
Data Sources
- Satellite: Sentinel-2A Level-2A (atmospherically corrected)
- Provider: Microsoft Planetary Computer
- Observation Date: 2026-04-16
- Cloud Cover: 4.829048%
- Spatial Resolution: 10 meters (NDVI, NDWI), 20 meters (MNDWI, resampled to 10m)
Index Calculations
- NDVI = (NIR - Red) / (NIR + Red) using Bands 8 and 4
- NDWI = (Green - NIR) / (Green + NIR) using Bands 3 and 8
- MNDWI = (Green - SWIR1) / (Green + SWIR1) using Bands 3 and 11
- Water Difference = MNDWI - NDWI (reveals water characteristics and sediment load)
- Inundation Risk = Composite metric identifying flood-vulnerable zones based on water indices
Processing Workflow
Images were processed using Python with the pystac-client and rasterio
libraries. Cloud masking was applied using the QA60 scene classification layer. Water and
vegetation indices were computed pixel-by-pixel. Inundation zones were identified by analyzing
water index patterns, historical flooding data (where available), and topographic context.
All geospatial outputs are provided as Cloud-Optimized GeoTIFFs (COGs) for efficient web
access and GIS integration.
Limitations
- Analysis represents a single-day snapshot; seasonal patterns require time-series monitoring
- Cloud cover and atmospheric conditions affect image quality
- 10-meter resolution may not capture small streams or narrow riparian corridors
- Study area boundaries reflect the satellite image crop, not watershed boundaries
- Inundation risk is inferred from spectral indices; local hydrology and infrastructure data improve accuracy
- NDWI/MNDWI can be affected by soil moisture, shadows, and vegetation in shallow water
Download Data & Maps
Images & Visualizations
- NDVI Color Map (Riparian Vegetation) (PNG)
- NDWI Color Map (Water Extent) (PNG)
- MNDWI Color Map (Enhanced Water) (PNG)
- MNDWI-NDWI Difference Map (PNG)
- Water Difference Legend (PNG)
- Inundation Risk Map (PNG)
- Inundation Legend (PNG)
- Combined Water Overlay (PNG)
Geospatial Data (Cloud-Optimized GeoTIFFs)
- NDVI GeoTIFF (COG)
- NDWI GeoTIFF (COG)
- MNDWI GeoTIFF (COG)
- Water Difference GeoTIFF (COG)
- Inundation Risk GeoTIFF (COG)
Statistical Data
How to Cite This Analysis
Recommended Citation
Yaragarla, R. (2026). Water Resources & Flood Risk Assessment: Australia-DarlingtonPoint-Coleambally-Bundure-part2-region. I Hug Trees. Retrieved from https://ihugtrees.org/data-analytics/sentinel-ndvi/Australia-DarlingtonPoint-Coleambally-Bundure-part2-region/2026/04/18/digest.html
Satellite data: Copernicus Sentinel-2 (ESA), processed via Microsoft Planetary Computer.
BibTeX Entry
@misc{ihugtrees_water_australia_darlingtonpoint_coleambally_bundure_part2_region_2026,
  author = {Yaragarla, Ramkumar},
  title = {Water Resources \& Flood Risk Assessment: Australia-DarlingtonPoint-Coleambally-Bundure-part2-region},
  year = {2026},
  publisher = {I Hug Trees},
  url = {https://ihugtrees.org/data-analytics/sentinel-ndvi/Australia-DarlingtonPoint-Coleambally-Bundure-part2-region/2026/04/18/digest.html},
  note = {Satellite data: Copernicus Sentinel-2}
}
License
This analysis and associated datasets are licensed under Creative Commons Attribution 4.0 International (CC BY 4.0). You are free to share and adapt this work with appropriate attribution.
Planetary Computer Citation
If using Microsoft Planetary Computer data, please cite: microsoft/PlanetaryComputer (2022)
Further Reading
Explore related urban green cover analyses and environmental insights from other regions: