I Hug Trees Logo

Urban Trees & Urban Forestry

The Science of Growing Greener, Healthier, More Liveable Cities

From canopy science to satellite monitoring: transforming the world's urban landscapes

Navigate This Guide:

What Is Urban Forestry & Urban Greening? Defining the Science of City Trees

Urban forestry is far more than planting trees along pavements. It is the integrated science of managing tree populations, green infrastructure, and ecological systems within and around cities to deliver sustained environmental, social, and economic benefits to urban communities.

Key Distinction: Urban greening is the broader practice. Urban forestry is the discipline that sits at its heart, treating city trees not as street decoration but as critical infrastructure as important as roads, pipes, and power lines.

Defining Urban Forestry: Scope and Scale

Urban forestry encompasses all trees and woody vegetation within the urban and peri-urban environment:

  • Street trees and boulevard plantings along roads and footpaths
  • Park forests and urban woodlands within municipal greenspaces
  • Private garden trees on residential and commercial properties
  • Riparian corridors along urban waterways and stormwater channels
  • Green roofs, living walls, and vertical gardens on built structures
  • Peri-urban forests in the transitional zone between city and countryside

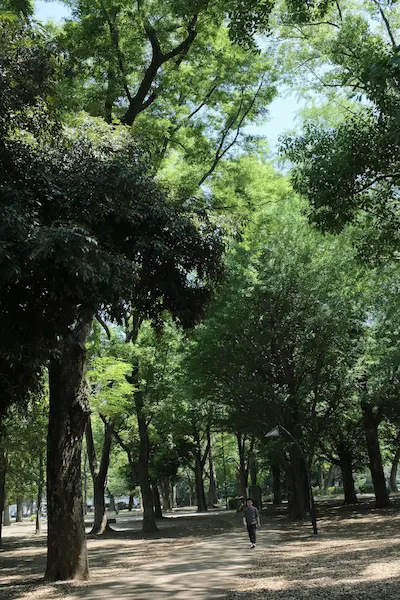
Together, these elements form the urban tree canopy: the total area of city land shaded by tree foliage when viewed from above. Canopy cover percentage is the primary metric by which urban forests are measured and managed.

Urban Greening: A Systems-Level Approach

Urban greening is the policy and planning framework that drives urban forestry decisions. It integrates trees into urban master plans, zoning regulations, building codes, and climate adaptation strategies. Leading cities now embed urban greening targets into legally binding climate policies, recognising that canopy coverage is as measurable and accountable as carbon emissions reductions.

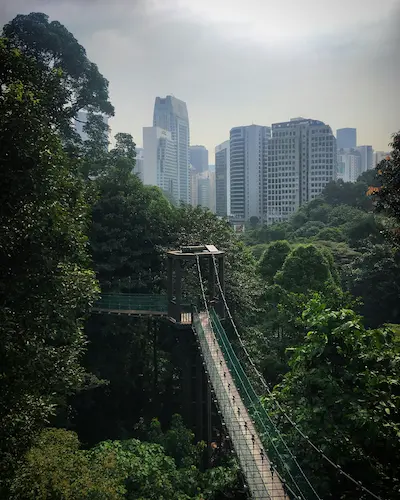
The concept of Green Infrastructure (GI) sits at the core of modern urban greening: a strategically planned network of natural and semi-natural areas that delivers a wide range of ecosystem services. Green infrastructure includes not just trees but also wetlands, green roofs, bioswales, and permeable surfaces, all working as a connected system.

Tree Canopy Coverage: The Critical Metric

Urban forestry science uses canopy coverage as its headline metric because it is measurable, comparable across cities, and directly correlates with ecosystem service delivery. Research establishes the following thresholds:

  • Below 10% canopy cover: Minimal ecosystem service provision; high urban heat island risk
  • 10 to 20% canopy cover: Moderate benefits, common in dense Asian and developing-world cities
  • 20 to 30% canopy cover: The internationally recommended minimum ("The 30% rule")
  • Above 30% canopy cover: High-performing urban forests; optimal climate, health, and biodiversity outcomes

Many of the world's most liveable cities β€” consistently topping global indices β€” maintain canopy coverage above 25%, validating the direct relationship between urban greening and quality of life.

The History and Evolution of Urban Forestry as a Discipline

Urban forestry emerged as a formal academic discipline in the 1960s and 1970s, initially focused on arboriculture: the care of individual trees. The field evolved dramatically when researchers began quantifying the collective ecosystem services of urban tree populations using tools like USDA Forest Service's i-Tree software, developed in the 1990s.

Today, urban forestry is a data-driven, satellite-supported science that integrates ecology, hydrology, public health, urban planning, climate science, and social equity. The urban forest is no longer managed tree by tree but as a dynamic, data-monitored ecosystem.

Green Infrastructure vs Grey Infrastructure

Traditional urban development prioritises grey infrastructure: concrete, asphalt, pipes, and channels. These systems perform specific functions efficiently but generate heat, repel water, and offer no ecological value. Urban greening science now makes the economic case for replacing or supplementing grey infrastructure with green alternatives:

  • A street tree provides stormwater interception at a fraction of the cost of engineered drainage
  • A green roof reduces building cooling loads more cost-effectively than additional air conditioning
  • An urban forest corridor cuts air conditioning demand across entire neighbourhoods

Critical Challenge: Urban tree mortality rates are high. Studies show that 20 to 50% of newly planted urban trees fail within 10 years due to compacted soils, inadequate watering, pollution stress, and poor species selection. Planting alone is insufficient without science-based establishment and aftercare programmes.

Aerial view of urban tree canopy over city

Canopy coverage: the primary metric of urban forest health

Street trees in urban boulevard

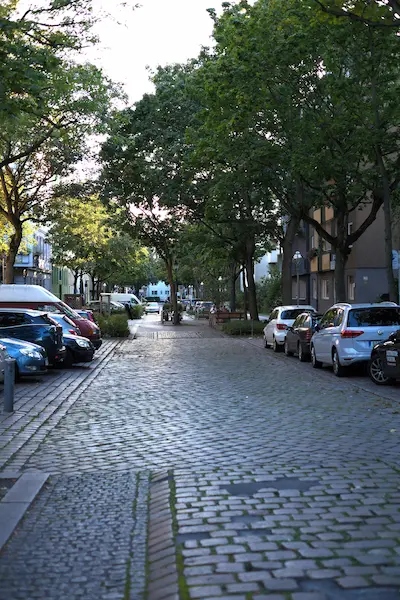
Street trees: urban forestry's most visible layer

Green roof and living wall urban greening

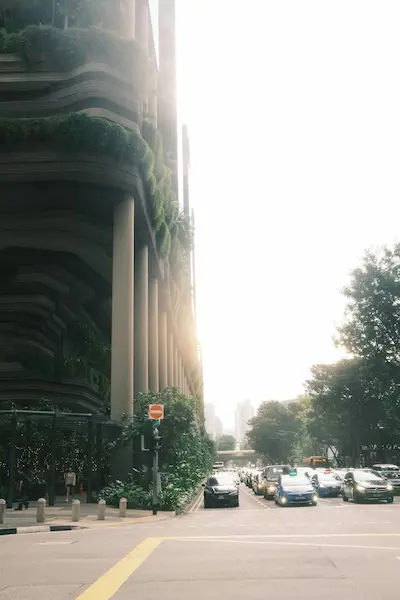
Green roofs and walls extend urban greening vertically

πŸ“Š

Hug Analytics: Tracking Urban Forest Health from Space

At I Hug Trees, we monitor urban forests the way cities should: from space, at scale, and in near real-time. Hug Analytics is our geospatial data platform that fuses satellite imagery, NDVI and EVI indices, land surface temperature data, and machine learning to map, measure, and benchmark urban tree canopies across the world's major cities.

We calculate canopy coverage at 10-metre resolution, map urban heat islands against tree distribution, and track year-on-year greening or loss trends with 40+ years of historical Landsat data. Our platform translates complex satellite science into actionable insights for urban planners, policymakers, researchers, and engaged citizens.

Whether you want to compare your city's canopy coverage against global benchmarks, identify underserved neighbourhoods that need urgent greening, or validate the impact of a planting programme, Hug Analytics delivers the evidence base you need.

Explore Hug Analytics β†’ Urban Forestry Data Hub β†’

Why Urban Trees Matter: Climate Resilience, Public Health & Economic Value of Urban Greening

Urban trees are not decorative. They are working infrastructure that delivers measurable, quantifiable returns across climate, health, and economic dimensions. The science is unambiguous: cities with more trees are cooler, healthier, safer, and more economically productive.

Urban Heat Island Mitigation Through Urban Forestry

The Urban Heat Island (UHI) effect causes cities to be 2 to 10Β°C warmer than surrounding rural areas due to heat-absorbing dark surfaces, waste heat from vehicles and air conditioning, and the absence of evapotranspiring vegetation. Urban trees attack this problem through two mechanisms:

  • Shading: Tree canopies block up to 90% of incoming solar radiation, directly cooling surfaces beneath them. Shaded pavement can be 11 to 25Β°C cooler than unshaded pavement
  • Evapotranspiration: A single mature tree transpires 100 to 200 litres of water per day, releasing cooling energy equivalent to five average room air conditioners running for 20 hours

Strategic urban forestry β€” targeting tree planting at heat hotspots identified through satellite thermal data β€” can reduce neighbourhood peak temperatures by 3 to 5Β°C, cutting heat-related mortality and reducing air conditioning energy demand by up to 30%.

Urban Trees and Air Quality: The Pollution Filter

Urban air pollution kills an estimated 4.2 million people annually. Urban trees act as biological filters:

  • Leaves intercept and absorb PM2.5 and PM10 particulate matter, the most dangerous air pollutants
  • Stomata absorb gaseous pollutants including nitrogen dioxide (NOβ‚‚), sulfur dioxide (SOβ‚‚), and ozone (O₃)
  • Dense urban tree corridors reduce streetside particulate pollution by 25 to 50% compared to treeless streets

However, urban forestry science adds nuance: certain tree species emit volatile organic compounds (VOCs) that worsen ground-level ozone under heat stress. Species selection matters critically. Low-VOC native species deliver clean air benefits without the chemistry penalty.

Urban Greening and Mental Health: The Biophilia Effect

Decades of research confirm that urban nature access directly improves mental health outcomes. Key findings:

  • Residents within 300 metres of urban green space show 11% lower rates of anxiety and depression
  • Hospital patients with window views of trees recover faster and require less pain medication (Ulrich, 1984 β€” the foundational study that launched environmental psychology)
  • Fifteen minutes of walking under urban tree canopy reduces cortisol (stress hormone) levels measurably
  • Neighbourhoods with 10% more tree canopy have lower rates of violent crime, anti-social behaviour, and domestic violence

Stormwater Management and Urban Flooding

Impermeable urban surfaces funnel rainfall directly into drainage systems, causing flash flooding and overwhelmed sewers. Urban trees intercept and absorb rainfall before it reaches the ground:

  • A mature urban tree intercepts 1,500 to 2,000 litres of rainfall annually
  • Tree root systems create macro-pores in soil that dramatically increase infiltration rates
  • Urban forests reduce stormwater runoff by 15 to 35% across catchment areas

In cities investing in urban forestry as stormwater infrastructure, the cost savings in avoided drainage upgrades run to tens of millions of dollars annually.

The Economic Case for Urban Forestry Investment

Urban trees are among the highest-returning public investments available to city governments. Research from i-Tree and similar platforms consistently finds that every $1 invested in urban tree planting and management returns $2.25 to $5.82 in ecosystem services: energy savings, stormwater management, property value uplift, air quality, and health cost reductions.

Property values adjacent to mature urban trees are 10 to 15% higher than equivalent properties on treeless streets. This effect is large enough to generate additional property tax revenues that can offset the full cost of urban forestry programmes.

Real-World Proof: New York City's MillionTreesNYC programme planted 1 million trees between 2007 and 2015. Independent analysis found the programme delivers $122 million in annual ecosystem service benefits against an annual management cost of $28 million β€” a 4:1 return on investment.

Urban Biodiversity: Trees as Habitat Networks

Urban tree canopies support surprisingly rich biodiversity. Studies in London found over 280 bird species and 270 butterfly and moth species associated with urban trees and green corridors. Urban forestry that prioritises native species, structural diversity, and habitat connectivity can deliver urban nature networks rivalling peri-urban natural areas in biodiversity value.

Urban Tree Impact Numbers

2–10Β°C UHI reduction potential
$5.82 Return per $1 invested
50% Street pollution reduction
15% Property value uplift near trees

Services Urban Trees Deliver

  • Heat island cooling via shade & evapotranspiration
  • Particulate matter and pollution filtration
  • Stormwater interception and infiltration
  • Carbon sequestration and storage
  • Mental health and wellbeing uplift
  • Biodiversity corridor provision
  • Noise buffering and acoustic comfort
  • Property value appreciation
Thermal map showing urban heat island and tree cooling effect

Thermal imaging: trees cool cities measurably

🌑️ Urban Heat Island Analysis

Explore our satellite thermal data tracking heat island intensity against canopy cover across major cities.

β†’

🌳 Urban Greening Strategies

  • Street Tree Programmes: Systematic canopy expansion along roads
  • Urban Woodlands: Multi-layered forest ecosystems within parks
  • Green Roofs & Walls: Vertical greening of built structures
  • Bioswales & Rain Gardens: Greened stormwater management
  • Community Orchards: Productive urban food forestry
  • Tree Equity Mapping: Targeting canopy gaps in underserved areas

Innovation: Structural Soil

CU-Soil (Cornell University structural soil) and Silva Cell systems allow tree roots to grow under pavements, enabling full canopy development in paved urban environments β€” the biggest single breakthrough in urban tree establishment science.

Dense urban woodland within a city park

Urban woodlands: maximum ecological value in city parks

πŸ—ΊοΈ Canopy Gap Analysis

See how we map canopy cover deficits across urban areas to identify priority planting zones.

β†’

Urban Greening Strategies & Innovation: How Cities Are Building Their Forest Canopy

Urban greening is accelerating globally, driven by climate emergency declarations, public health evidence, and a new generation of city leaders who understand the infrastructure value of trees. The strategies below represent the frontier of urban forestry practice.

Street Tree Programmes: The Backbone of Urban Forestry

Street trees are the most visible and widespread urban forestry intervention. Effective street tree programmes require far more than planting a sapling in a pavement pit. They demand:

  • Species diversity: Urban forests should use at least 10% per species to prevent catastrophic loss from a single pest or disease (the 10-20-30 Rule)
  • Structural soil systems: CU-Soil or Silva Cell technologies create underground root growth space under pavements, allowing trees to reach maturity rather than declining in cramped pits
  • Tree equity mapping: Satellite analysis reveals that lower-income, minority-majority neighbourhoods typically have 30 to 40% less canopy cover than wealthier areas β€” a social justice dimension urban forestry must address
  • Aftercare protocols: Three to five years of watering, mulching, and monitoring dramatically improves establishment success from 50% to 90%

Urban Woodlands and Multi-Layered Forest Systems

Urban woodlands β€” multi-layered plantings within parks and along waterways β€” deliver the highest ecological value per hectare of any urban greening intervention. By replicating the structural complexity of natural forests (canopy, understorey, shrub layer, ground layer), urban woodlands provide:

  • Maximum carbon storage per unit area
  • Richest biodiversity habitat
  • Greatest stormwater infiltration capacity
  • Strongest cooling effect through combined evapotranspiration

The Miyawaki method (dense planting of native species at 3 to 5 plants per square metre) has revolutionised urban woodland creation, establishing functioning multi-layered forests within 5 to 10 years that would take decades under conventional planting approaches. Over 3,000 Miyawaki forests have been established globally since 2010.

Green Roofs and Living Walls in Urban Greening

Not all urban greening happens at ground level. Green roofs and living walls extend urban forestry into the vertical dimension, enabling greening in the most densely built city environments where ground-level planting space is severely constrained.

  • Extensive green roofs (shallow substrate, drought-tolerant plants) reduce rooftop temperatures by 30 to 50Β°C and cut building energy use by 10 to 15%
  • Intensive green roofs (deeper substrate, shrubs and small trees) approach urban woodland in ecological value and can support meaningful biodiversity
  • Living walls reduce building surface temperatures by up to 10Β°C and provide acoustic insulation equivalent to 40dB attenuation

Bioswales, Rain Gardens, and Nature-Based Stormwater Management

Urban greening increasingly integrates with stormwater management. Bioswales (vegetated drainage channels) and rain gardens (depressed planting areas that capture runoff) replace grey concrete infrastructure with green alternatives that simultaneously manage water, sequester carbon, reduce heat, and support pollinators.

Cities like Portland, Melbourne, and Copenhagen have invested heavily in green-blue infrastructure networks that combine urban forestry with water-sensitive urban design, reducing stormwater system costs by hundreds of millions of dollars while delivering liveable, green streetscapes.

Sponge City Design and Urban Greening Integration

China's Sponge City initiative, launched in 2015 across 30 pilot cities, exemplifies the integration of urban forestry into city-wide water management. Sponge Cities aim to absorb, store, filter, and release 70% of rainfall locally through permeable surfaces, urban wetlands, greenways, and tree canopy. Urban trees are central to the sponge city concept, functioning as the biological infiltration and evapotranspiration infrastructure that enables the whole system to work.

Community Urban Forestry and Citizen Science

The most enduring urban forestry programmes combine professional management with deep community engagement. Citizen science tree-tagging platforms (TreeTag, iNaturalist, OpenTreeMap) have mapped millions of urban trees globally, creating datasets that feed into management planning and monitoring. Community planting events build constituencies for urban greening that sustain political will and funding across electoral cycles.

Urban Forestry Principle: The best urban tree is the right tree in the right place, planted correctly, watered for five years, and managed throughout its life. One well-managed tree delivers more value than ten neglected ones.

Soil & Ecosystem Health in Cities: The Hidden Foundation of Urban Forestry

Urban trees struggle not because of a lack of water or sunlight, but because of soil. Compacted, contaminated, biologically depleted urban soils are the primary cause of urban tree failure. Fixing the soil fixes the forest.

Urban soils are among the most degraded on Earth. Centuries of construction, compaction, pollution, and sealing have destroyed the biological communities and physical structure that trees depend upon. Solving urban tree failure means solving urban soil failure first.

The Urban Soil Problem: Compaction, Contamination, and Biological Death

Urban soils suffer from a triple burden that standard arboriculture rarely addresses:

Mycorrhizal Fungi in Urban Forests

Mycorrhizal fungi are as critical to urban trees as they are to desert greening. Urban trees planted without inoculation into depleted soils must establish from scratch β€” often failing before networks can form. Urban forestry research shows that mycorrhizal inoculation at planting increases urban tree survival rates by 35 to 60% and accelerates canopy development by one to three years.

The challenge in cities is soil contamination: heavy metals and road salts inhibit mycorrhizal colonisation. Urban forestry practitioners now use metal-tolerant mycorrhizal strains bred specifically for urban conditions, representing one of the most significant advances in urban tree establishment science in the past decade.

Soil Volume and Structural Solutions

The single most critical factor in urban tree longevity is soil volume accessible to roots. Research shows a direct linear relationship between soil volume and tree canopy size: trees with access to less than 8 cubic metres of quality soil rarely exceed 5 metres in height, regardless of species or irrigation.

Modern urban forestry solutions expand soil volume beneath pavements:

Urban Composting and Biochar for City Soils

As in desert greening, biochar and organic matter amendment dramatically improve urban soil function. In urban applications, biochar provides additional benefits:

Cities like Singapore and Copenhagen now incorporate biochar into standard urban tree pit specifications, treating it as core infrastructure rather than an optional amendment.

Biological Soil Restoration in Urban Environments

Restoring urban soil biology requires deliberate inoculation with beneficial microbial communities. Leading urban forestry programmes now use:

Innovation: Bioremediation Trees: Certain urban tree species β€” including willows, poplars, and sunflowers β€” actively remediate contaminated urban soils through phytoremediation: absorbing and breaking down petroleum hydrocarbons and heavy metals. Strategic planting of bioremediation species is now used to clean brownfield sites before establishing longer-lived urban forest trees.

1.4 g/cmΒ³ Max density for root penetration
8 mΒ³ Minimum soil volume for viable canopy
35–60% Survival improvement with mycorrhizae

The lesson applies equally to desert and city: the soil ecosystem is not a background condition β€” it is the active foundation. Invest in urban soil biology, and urban forests will flourish. Ignore it, and no planting budget will be large enough to compensate.

Satellite Monitoring, NDVI & AI for Urban Forests: Measuring Urban Greening from Space

This is what sets I Hug Trees apart. We don't rely on tree census data collected once per decade. We monitor urban forests continuously from space, using the same satellite platforms and spectral indices used by leading climate research institutions β€” and we make the findings publicly accessible.

How Remote Sensing Measures Urban Tree Canopy

Satellites capture multispectral imagery: light reflected from Earth's surface across visible, near-infrared, and shortwave-infrared wavelengths. Urban trees have a distinctive spectral signature β€” strong near-infrared reflectance, low visible red reflectance β€” that separates them from buildings, roads, grass, and bare soil with high accuracy.

At I Hug Trees, we use multiple satellite platforms for urban forest monitoring:

  • Sentinel-2: 10m resolution, 5-day revisit cycle, free access. Our primary platform for urban canopy mapping and seasonal monitoring
  • Landsat 8/9: 30m resolution, 40+ year archive. Essential for tracking long-term urban greening or loss trends since the 1980s
  • MODIS Terra/Aqua: 250m to 500m resolution, daily coverage. Used for regional and continental urban greening analysis
  • WorldView-3 / PlanetScope: Sub-metre resolution. Used for detailed individual tree mapping and species classification in specific study cities

NDVI, EVI and Urban-Specific Vegetation Indices

The Normalized Difference Vegetation Index (NDVI) is the foundational metric but has known limitations in dense urban environments:

  • Saturation in dense canopy: NDVI saturates above 0.8, losing sensitivity in high-biomass urban woodlands
  • Urban background effects: Dark asphalt and bright concrete create spectral noise that affects NDVI in sparse urban tree conditions

We therefore use a suite of indices calibrated for urban environments:

  • EVI (Enhanced Vegetation Index): Corrects for atmospheric and soil background effects; performs better than NDVI in high-density canopy
  • NDRE (Red-Edge Normalized Difference): Sensitive to chlorophyll content; detects early tree stress before it's visible to NDVI
  • LST (Land Surface Temperature): Thermal infrared mapping of surface temperatures, used to quantify urban heat island intensity and tree cooling effects
  • BSI (Bare Soil Index): Maps impervious surfaces and bare ground to identify urban greening opportunity zones

Temporal NDVI Analysis: Tracking Urban Greening Over Decades

Single-point measurements describe current state. Time-series analysis reveals the story of urban forest change. Our Landsat archive analysis, spanning 1984 to the present, enables us to answer questions that matter deeply to urban planners:

  • Is this city's canopy coverage growing or declining?
  • Which neighbourhoods have lost significant canopy over the past 20 years, and what drove the losses?
  • Has a specific urban greening programme genuinely increased canopy coverage, or did gains in one area come at the expense of losses elsewhere?
  • How has urban forest structure changed β€” are canopy gaps increasing, indicating tree loss outpacing new growth?

Tree Equity and Environmental Justice Mapping

Satellite canopy mapping reveals a pattern repeated across virtually every major city studied: canopy coverage is strongly correlated with socioeconomic status. High-income residential areas average 30 to 45% canopy cover; low-income areas average 8 to 15%. Our spatial equity analysis cross-references canopy maps with demographic and income data to produce Tree Equity Scores that identify where investment is most urgently needed and most impactful.

I Hug Trees Capability: Our urban forest monitoring platform tracks canopy coverage, NDVI trends, heat island intensity, and equity gaps for cities across six continents, updated seasonally with Sentinel-2 imagery and annually with comprehensive Landsat archive analysis.

Predictive Analytics: Where to Plant for Maximum Urban Cooling

Machine learning models trained on our urban heat and canopy datasets can predict the thermal impact of tree planting in specific locations before a single tree is planted. By integrating land surface temperature, solar exposure, street geometry, soil maps, and existing canopy data, our models identify the highest-value planting sites for urban heat island mitigation β€” enabling cities to maximise cooling impact per dollar of planting budget.

10m Sentinel-2 canopy mapping resolution
40+ Years of Landsat urban forest history
6 Continents monitored

πŸ›°οΈ Our Urban Monitoring Stack

  • Sentinel-2: 10m canopy mapping
  • Landsat 8/9: 40-year change detection
  • MODIS: Daily thermal & greenness
  • WorldView-3: Tree-level species detection
  • Google Earth Engine: Cloud-scale processing
  • ML Models: Equity scoring & heat prediction

Index Suite

  • NDVI: Vegetation density baseline
  • EVI: Dense canopy accuracy
  • NDRE: Early stress detection
  • LST: Surface temperature mapping
  • BSI: Impervious surface detection
  • Tree Equity Score: Canopy justice mapping

πŸ“‘ Urban NDVI Analysis Hub

Access our satellite-derived NDVI, EVI, and LST datasets for cities across the globe.

β†’

βš–οΈ Tree Equity Mapping

Explore our canopy equity analysis showing the relationship between tree cover and socioeconomic data.

β†’

Urban Forestry Data for the World's Most Liveable Cities: Satellite Canopy & Green Index Analysis

We track urban tree canopy, NDVI trends, urban heat islands, and greenery indices for the world's most liveable cities β€” translating satellite science into comparable, accessible city-level data.

🌿 The Green Index: Ranking the World's Most Liveable Cities by Urban Greening

Which liveable city is truly the greenest? Our Green Index ranks the world's most liveable cities based on satellite-derived canopy coverage, NDVI trends, Land Surface Temperature differentials, green space equity scores, and year-on-year canopy change β€” providing the most rigorous, data-driven urban greening benchmark available.

Explore the Green Index β†’

Below, we publish individual satellite analysis reports for each of the world's top liveable cities. Each report provides NDVI time-series data, canopy coverage percentages, urban heat island intensity maps, green equity scores, and year-on-year change analysis β€” all derived from multi-decadal satellite imagery and updated seasonally.

City Analysis Β· 01

Sydney, Australia 01

Satellite-derived NDVI, canopy coverage, urban heat island intensity, and green equity analysis.

View Full Analysis β†’
City Analysis Β· 02

Auckland, Newzealand 02

Satellite-derived NDVI, canopy coverage, urban heat island intensity, and green equity analysis.

View Full Analysis β†’
City Analysis Β· 03

Adelaide, Australia 03

Satellite-derived NDVI, canopy coverage, urban heat island intensity, and green equity analysis.

View Full Analysis β†’
City Analysis Β· 04

Melbourne, Australia 04

Satellite-derived NDVI, canopy coverage, urban heat island intensity, and green equity analysis.

View Full Analysis β†’
City Analysis Β· 05

Osaka, Japan 05

Satellite-derived NDVI, canopy coverage, urban heat island intensity, and green equity analysis.

View Full Analysis β†’
City Analysis Β· 06

Zurich, Switzerland 06

Satellite-derived NDVI, canopy coverage, urban heat island intensity, and green equity analysis.

View Full Analysis β†’
City Analysis Β· 07

Vienna, Switzerland 07

Satellite-derived NDVI, canopy coverage, urban heat island intensity, and green equity analysis.

View Full Analysis β†’
City Analysis Β· 08

Copenhagen, Denmark 08

Satellite-derived NDVI, canopy coverage, urban heat island intensity, and green equity analysis.

View Full Analysis β†’
City Analysis Β· 09

Geneva, Switzerland 09

Satellite-derived NDVI, canopy coverage, urban heat island intensity, and green equity analysis.

View Full Analysis β†’
City Analysis Β· 10

Vancouver, Canada 10

Satellite-derived NDVI, canopy coverage, urban heat island intensity, and green equity analysis.

View Full Analysis β†’
City Analysis Β· 11

Singapore, Singapore 11

Satellite-derived NDVI, canopy coverage, urban heat island intensity, and green equity analysis.

View Full Analysis β†’
City Analysis Β· 12

Chennai, Asia 12

Satellite-derived NDVI, canopy coverage, urban heat island intensity, and green equity analysis.

View Full Analysis β†’

πŸ“Š Full Urban Forestry Data Analytics Hub

Access all city analyses, comparative dashboards, NDVI time-series downloads, and the complete Green Index ranking in one place.

β†’

Urban Forestry & Urban Greening Weekly Digests: Stay Current with Global Urban Tree Science

Urban forestry is a fast-moving field. New research, policy announcements, planting programme results, and satellite findings emerge weekly. Our curated digests keep you current without the noise.

The I Hug Trees editorial and research teams track urban forestry developments globally β€” from peer-reviewed journal publications to city government announcements, NGO reports, and satellite monitoring updates. We distil these into three focused digest formats, each serving a distinct audience and purpose.

🌳

Urban Forestry Research Digest

A weekly round-up of the most significant peer-reviewed research, policy papers, and data releases in urban forestry and urban greening science. Includes NDVI study summaries, canopy coverage reports, and urban heat island research from institutions worldwide.

Subscribe & Read Latest β†’
πŸ™οΈ

Urban Greening Cities Digest

Weekly coverage of urban greening initiatives, tree-planting programme launches, green infrastructure investments, and city government policies from around the world. Tracks which cities are gaining or losing canopy, and what policy decisions are driving change.

Subscribe & Read Latest β†’
πŸ›°οΈ

Satellite & Data Urban Greening Digest

A specialist weekly digest focused on remote sensing, NDVI monitoring, urban canopy mapping, and geospatial data releases relevant to urban forestry. Covers new satellite datasets, analysis methodologies, and data platform updates from I Hug Trees and global institutions.

Subscribe & Read Latest β†’

Stay Informed: All three digests are free to access. Subscribe via RSS or bookmark the digest pages to stay current with the urban forestry developments that matter most to your work, research, or city.

Global Urban Greening Case Studies: What Has Worked, What Failed, and Why

Urban forestry has a varied global track record. By examining both landmark successes and costly failures, we can identify the principles that determine whether urban greening programmes deliver lasting results.

City in a Garden

Singapore

Approach: Singapore's "City in a Garden" vision has driven 60 years of sustained urban forestry investment. The Parks and Trees Act mandates tree protection. Green Plot Ratio guidelines require greenery in all new developments. The National Parks Board manages over 500,000 trees on public land.

Outcome: Canopy coverage grew from 36% in 1986 to 47% by 2020 despite a doubling of the city's built-up area. Singapore is the only megacity to have significantly increased canopy coverage while simultaneously intensifying urban development.

Key Lesson: Sustained political commitment, strong legislation, and integration of urban forestry into development regulation β€” not one-off planting campaigns β€” deliver lasting canopy gains.

47% Canopy coverage (2020)
500K+ Managed public trees

Urban Forest Strategy

Melbourne, Australia

Approach: Melbourne's Urban Forest Strategy (2012) was a global pioneer: a data-driven, 25-year plan to double canopy coverage from 22% to 40% by 2040. The city mapped every tree, assigned each one an email address (generating 3,000+ public messages to trees), and published open-access canopy data.

Outcome: Canopy coverage is increasing despite prolonged drought stress. The programme is recognised globally as a model for community-engaged, data-transparent urban forestry.

Key Lesson: Open data and community engagement create political durability for long-term urban forestry investment across multiple election cycles.

40% Canopy target by 2040
70K+ Trees mapped with IDs

MillionTreesNYC

New York City, USA

Approach: New York City's MillionTreesNYC programme (2007–2015) planted 1 million trees across all five boroughs, prioritising low-canopy, high-heat, low-income neighbourhoods. Community volunteers participated in planting events, building civic ownership of the urban forest.

Outcome: Target achieved in 2015. Independent analysis found $122 million in annual ecosystem service benefits against $28 million in annual management costs β€” a demonstrable 4:1 ROI. Survival rates averaged 70%, higher than global norms.

Key Lesson: Quantifying ecosystem services in economic terms builds the political and financial case for sustained urban forestry funding.

1M Trees planted
4:1 Return on investment

National Park City

London, United Kingdom

Approach: London became the world's first National Park City in 2019, a designation recognising that more than 47% of the city's area is green or blue space. The London Urban Forest Partnership coordinates urban forestry across 33 boroughs, targeting 10% canopy cover increase by 2050.

Challenge: Air pollution, extreme rainfall events, and drought stress are killing established trees faster than new ones mature. Tree mortality from urban stressors now exceeds new planting rates in some inner boroughs.

Key Lesson: Protecting existing mature trees delivers more canopy benefit than any planting programme. Mature tree loss is the biggest threat to urban canopy globally.

47% Green/blue space coverage
+10% Canopy target by 2050

Green Corridors (Corredores Verdes)

MedellΓ­n, Colombia

Approach: MedellΓ­n converted 30 of its hottest urban roads into green corridors, planting 120,000 trees and 350,000 plants along 18km of streets. The programme also included bioswales, green roofs, and urban gardens, creating integrated green-blue corridors.

Outcome: Corridor temperatures dropped by 2 to 3Β°C within two years. The programme won the 2019 Lee Kuan Yew World City Prize. A city once synonymous with violence and urban hardship is now a global urban greening model.

Key Lesson: Urban greening delivers rapid, measurable temperature reductions and transforms city identity, creating positive feedback loops of civic pride and investment.

120K Trees planted in corridors
3Β°C Temperature reduction

Mass Planting Without Infrastructure

Multiple Cities, Global

Pattern: Across numerous cities in South Asia, Africa, and Latin America, high-profile tree-planting announcements β€” often in the millions of trees β€” have yielded very little lasting canopy gain. Trees are planted in compacted soils, without irrigation, aftercare, or species-site matching. Survival rates of 10 to 25% are common.

Why It Fails: Urban tree planting without soil preparation, species selection science, structural soil systems, watering programmes, and long-term maintenance budgets is performative, not functional. Political photo opportunities, not ecological outcomes, drive these programmes.

Key Lesson: Per-tree cost should be evaluated over a 10-year horizon, including establishment and maintenance. Cheap planting is the most expensive kind.

10–25% Typical survival without aftercare
10yr True cost horizon for evaluation

Universal Urban Forestry Lessons:

  • Protect mature trees first β€” they are irreplaceable canopy infrastructure
  • Soil preparation and structural solutions are non-negotiable prerequisites
  • Species diversity and native species reduce systemic risk dramatically
  • Community engagement creates political durability that survives elections
  • Satellite monitoring separates genuine canopy gains from accounting illusions
  • Long-term aftercare budgets are as important as planting budgets

🏜️ Related: Desert Greening Guide

Explore our complete guide to desert greening, dryland restoration, and satellite monitoring of arid ecosystems.

β†’

🌳 Related: Tree Conservation Guide

Explore our comprehensive guide to tree conservation, including urban tree protection strategies and global deforestation monitoring.

β†’

πŸ“Š Hug Analytics: Urban Forest Data Platform

Access all our urban forestry satellite datasets, NDVI analyses, heat island maps, tree equity scores, and city comparison dashboards.

β†’